|
Download Data (XLS File) |
|
||||||||
|
||||||||
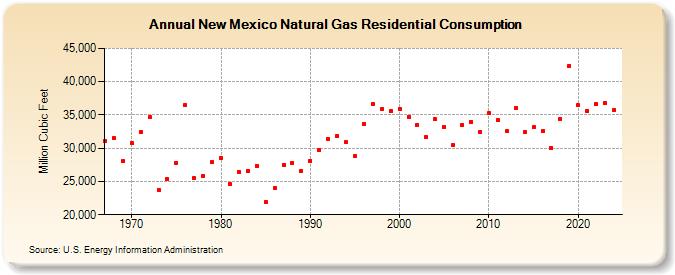
| New Mexico Natural Gas Residential Consumption (Million Cubic Feet) | ||||||||
| Decade | Year-0 | Year-1 | Year-2 | Year-3 | Year-4 | Year-5 | Year-6 | Year-7 | Year-8 | Year-9 |
|---|---|---|---|---|---|---|---|---|---|---|
| 1960's | 31,126 | 31,568 | 28,061 | |||||||
| 1970's | 30,771 | 32,396 | 34,621 | 23,730 | 25,331 | 27,826 | 36,476 | 25,525 | 25,882 | 27,874 |
| 1980's | 28,579 | 24,653 | 26,429 | 26,593 | 27,394 | 21,952 | 24,019 | 27,534 | 27,846 | 26,591 |
| 1990's | 28,145 | 29,767 | 31,433 | 31,843 | 30,868 | 28,770 | 33,689 | 36,623 | 35,877 | 35,548 |
| 2000's | 35,921 | 34,750 | 33,499 | 31,619 | 34,339 | 33,242 | 30,435 | 33,471 | 33,996 | 32,405 |
| 2010's | 35,253 | 34,299 | 32,515 | 36,024 | 32,374 | 33,130 | 32,577 | 29,993 | 34,438 | 42,384 |
| 2020's | 36,436 | 35,559 | 36,622 | 36,773 | 35,812 | NA |
| - = No Data Reported; -- = Not Applicable; NA = Not Available; W = Withheld to avoid disclosure of individual company data. |
| Release Date: 6/30/2026 |
| Next Release Date: 7/31/2026 |