|
Download Data (XLS File) |
|
||||||||
|
||||||||
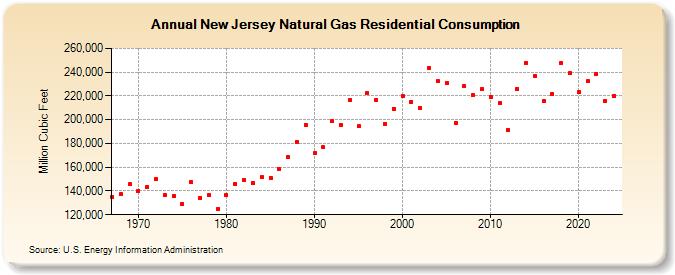
| New Jersey Natural Gas Residential Consumption (Million Cubic Feet) | ||||||||
| Decade | Year-0 | Year-1 | Year-2 | Year-3 | Year-4 | Year-5 | Year-6 | Year-7 | Year-8 | Year-9 |
|---|---|---|---|---|---|---|---|---|---|---|
| 1960's | 135,143 | 137,116 | 145,487 | |||||||
| 1970's | 140,219 | 143,197 | 149,924 | 136,625 | 135,843 | 129,406 | 147,508 | 134,138 | 136,347 | 124,901 |
| 1980's | 136,481 | 145,907 | 148,845 | 146,674 | 151,755 | 150,911 | 158,266 | 168,641 | 181,506 | 195,542 |
| 1990's | 171,660 | 176,640 | 198,462 | 195,569 | 216,873 | 194,432 | 222,619 | 216,925 | 196,658 | 209,399 |
| 2000's | 219,878 | 214,995 | 209,836 | 243,760 | 232,471 | 231,065 | 197,205 | 228,051 | 220,432 | 226,016 |
| 2010's | 219,141 | 213,630 | 191,371 | 226,195 | 247,742 | 237,104 | 215,510 | 221,608 | 247,585 | 239,055 |
| 2020's | 223,370 | 232,225 | 238,448 | 215,856 | 219,880 | NA |
| - = No Data Reported; -- = Not Applicable; NA = Not Available; W = Withheld to avoid disclosure of individual company data. |
| Release Date: 6/30/2026 |
| Next Release Date: 7/31/2026 |