|
Download Data (XLS File) |
|
||||||||
|
||||||||
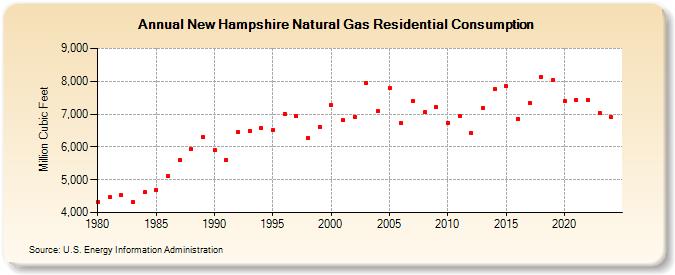
| New Hampshire Natural Gas Residential Consumption (Million Cubic Feet) | ||||||||
| Decade | Year-0 | Year-1 | Year-2 | Year-3 | Year-4 | Year-5 | Year-6 | Year-7 | Year-8 | Year-9 |
|---|---|---|---|---|---|---|---|---|---|---|
| 1980's | 4,331 | 4,465 | 4,526 | 4,309 | 4,613 | 4,698 | 5,102 | 5,604 | 5,927 | 6,290 |
| 1990's | 5,903 | 5,609 | 6,449 | 6,493 | 6,572 | 6,507 | 7,012 | 6,939 | 6,267 | 6,613 |
| 2000's | 7,274 | 6,812 | 6,922 | 7,940 | 7,086 | 7,793 | 6,718 | 7,394 | 7,054 | 7,213 |
| 2010's | 6,738 | 6,955 | 6,422 | 7,185 | 7,755 | 7,842 | 6,861 | 7,331 | 8,134 | 8,034 |
| 2020's | 7,403 | 7,438 | 7,426 | 7,046 | 6,910 | 8,500 |
| - = No Data Reported; -- = Not Applicable; NA = Not Available; W = Withheld to avoid disclosure of individual company data. |
| Release Date: 6/30/2026 |
| Next Release Date: 7/31/2026 |