|
Download Data (XLS File) |
|
||||||||
|
||||||||
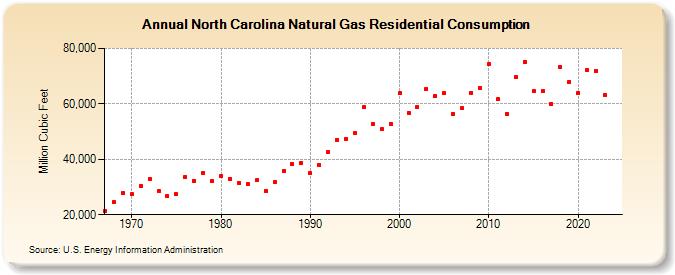
| North Carolina Natural Gas Residential Consumption (Million Cubic Feet) | ||||||||
| Decade | Year-0 | Year-1 | Year-2 | Year-3 | Year-4 | Year-5 | Year-6 | Year-7 | Year-8 | Year-9 |
|---|---|---|---|---|---|---|---|---|---|---|
| 1960's | 21,416 | 24,646 | 27,784 | |||||||
| 1970's | 27,353 | 30,434 | 33,043 | 28,435 | 26,830 | 27,466 | 33,727 | 32,277 | 35,072 | 32,244 |
| 1980's | 33,963 | 33,053 | 31,588 | 31,228 | 32,405 | 28,649 | 31,701 | 35,903 | 38,384 | 38,658 |
| 1990's | 35,003 | 37,976 | 42,588 | 47,104 | 47,451 | 49,379 | 58,812 | 52,894 | 50,786 | 52,853 |
| 2000's | 63,899 | 56,815 | 58,904 | 65,410 | 62,800 | 63,865 | 56,506 | 58,365 | 63,912 | 65,642 |
| 2010's | 74,520 | 61,644 | 56,511 | 69,654 | 75,178 | 64,523 | 64,547 | 59,933 | 73,262 | 67,948 |
| 2020's | 64,045 | 72,067 | 71,983 | 63,298 | 68,777 | 75,451 |
| - = No Data Reported; -- = Not Applicable; NA = Not Available; W = Withheld to avoid disclosure of individual company data. |
| Release Date: 6/30/2026 |
| Next Release Date: 7/31/2026 |