|
Download Data (XLS File) |
|
||||||||
|
||||||||
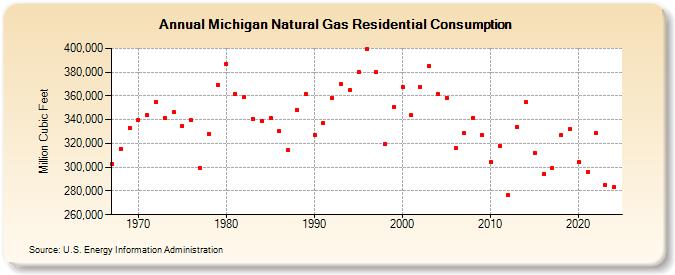
| Michigan Natural Gas Residential Consumption (Million Cubic Feet) | ||||||||
| Decade | Year-0 | Year-1 | Year-2 | Year-3 | Year-4 | Year-5 | Year-6 | Year-7 | Year-8 | Year-9 |
|---|---|---|---|---|---|---|---|---|---|---|
| 1960's | 302,472 | 315,694 | 333,264 | |||||||
| 1970's | 340,033 | 343,773 | 355,266 | 341,607 | 346,116 | 334,866 | 339,417 | 299,199 | 328,260 | 369,378 |
| 1980's | 387,279 | 361,752 | 358,778 | 340,732 | 338,996 | 341,026 | 330,240 | 314,293 | 348,512 | 361,667 |
| 1990's | 327,396 | 337,205 | 358,088 | 369,801 | 364,588 | 380,025 | 399,522 | 379,838 | 319,701 | 350,735 |
| 2000's | 367,728 | 343,682 | 367,765 | 385,568 | 362,024 | 358,623 | 315,769 | 328,432 | 341,754 | 327,113 |
| 2010's | 304,330 | 318,004 | 276,778 | 334,211 | 354,713 | 312,098 | 294,152 | 299,158 | 326,962 | 332,254 |
| 2020's | 304,194 | 296,039 | 328,712 | 284,916 | 273,737 | 330,998 |
| - = No Data Reported; -- = Not Applicable; NA = Not Available; W = Withheld to avoid disclosure of individual company data. |
| Release Date: 6/30/2026 |
| Next Release Date: 7/31/2026 |