|
Download Data (XLS File) |
|
||||||||
|
||||||||
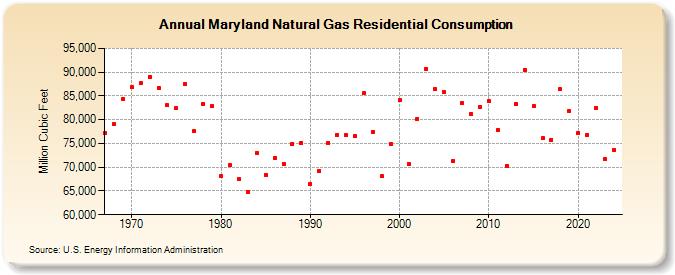
| Maryland Natural Gas Residential Consumption (Million Cubic Feet) | ||||||||
| Decade | Year-0 | Year-1 | Year-2 | Year-3 | Year-4 | Year-5 | Year-6 | Year-7 | Year-8 | Year-9 |
|---|---|---|---|---|---|---|---|---|---|---|
| 1960's | 77,130 | 79,015 | 84,406 | |||||||
| 1970's | 86,811 | 87,617 | 89,042 | 86,670 | 82,999 | 82,380 | 87,408 | 77,575 | 83,391 | 82,784 |
| 1980's | 68,080 | 70,423 | 67,500 | 64,716 | 73,012 | 68,399 | 71,896 | 70,670 | 74,918 | 75,138 |
| 1990's | 66,428 | 69,235 | 75,122 | 76,871 | 76,688 | 76,552 | 85,533 | 77,500 | 68,057 | 74,848 |
| 2000's | 84,082 | 70,691 | 80,122 | 90,669 | 86,382 | 85,768 | 71,345 | 83,457 | 81,180 | 82,699 |
| 2010's | 83,830 | 77,838 | 70,346 | 83,341 | 90,542 | 82,858 | 76,047 | 75,789 | 86,397 | 81,845 |
| 2020's | 77,274 | 76,874 | 82,532 | 71,637 | 73,468 | 84,490 |
| - = No Data Reported; -- = Not Applicable; NA = Not Available; W = Withheld to avoid disclosure of individual company data. |
| Release Date: 6/30/2026 |
| Next Release Date: 7/31/2026 |