|
Download Data (XLS File) |
|
||||||||
|
||||||||
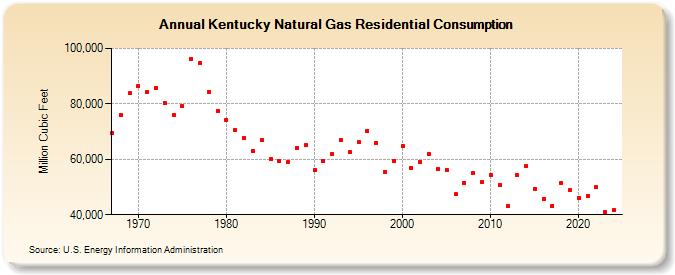
| Kentucky Natural Gas Residential Consumption (Million Cubic Feet) | ||||||||
| Decade | Year-0 | Year-1 | Year-2 | Year-3 | Year-4 | Year-5 | Year-6 | Year-7 | Year-8 | Year-9 |
|---|---|---|---|---|---|---|---|---|---|---|
| 1960's | 69,542 | 75,824 | 83,815 | |||||||
| 1970's | 86,473 | 84,197 | 85,881 | 80,233 | 76,129 | 79,156 | 96,351 | 94,646 | 84,436 | 77,438 |
| 1980's | 74,235 | 70,538 | 67,590 | 63,049 | 66,895 | 60,086 | 59,372 | 59,094 | 64,027 | 65,086 |
| 1990's | 56,064 | 59,465 | 61,911 | 66,909 | 62,533 | 66,149 | 70,232 | 66,033 | 55,545 | 59,220 |
| 2000's | 64,662 | 56,947 | 59,104 | 61,886 | 56,443 | 56,142 | 47,379 | 51,534 | 55,025 | 51,821 |
| 2010's | 54,391 | 50,696 | 43,065 | 54,208 | 57,590 | 49,426 | 45,502 | 43,253 | 51,476 | 48,777 |
| 2020's | 45,961 | 46,920 | 49,821 | 40,946 | 41,760 | 49,283 |
| - = No Data Reported; -- = Not Applicable; NA = Not Available; W = Withheld to avoid disclosure of individual company data. |
| Release Date: 7/31/2026 |
| Next Release Date: 8/31/2026 |