|
Download Data (XLS File) |
|
||||||||
|
||||||||
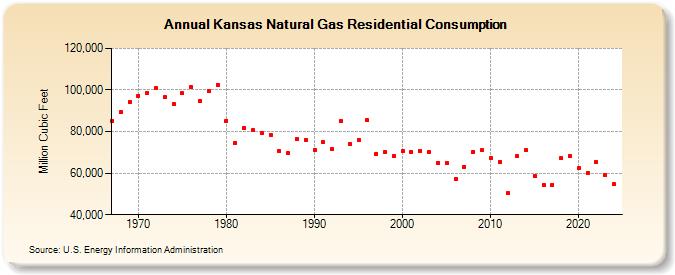
| Kansas Natural Gas Residential Consumption (Million Cubic Feet) | ||||||||
| Decade | Year-0 | Year-1 | Year-2 | Year-3 | Year-4 | Year-5 | Year-6 | Year-7 | Year-8 | Year-9 |
|---|---|---|---|---|---|---|---|---|---|---|
| 1960's | 84,912 | 89,372 | 94,320 | |||||||
| 1970's | 97,317 | 98,644 | 100,720 | 96,468 | 93,363 | 98,372 | 101,330 | 94,592 | 99,411 | 102,413 |
| 1980's | 85,294 | 74,701 | 81,804 | 80,538 | 79,340 | 78,350 | 70,582 | 69,653 | 76,420 | 76,033 |
| 1990's | 71,327 | 74,825 | 71,522 | 84,896 | 74,156 | 75,846 | 85,376 | 69,415 | 70,217 | 68,146 |
| 2000's | 70,601 | 70,182 | 70,863 | 70,369 | 65,049 | 64,923 | 57,078 | 63,091 | 70,336 | 71,068 |
| 2010's | 67,117 | 65,491 | 50,489 | 68,036 | 71,115 | 58,384 | 54,060 | 54,445 | 67,134 | 68,123 |
| 2020's | 62,313 | 60,146 | 65,343 | 59,005 | 53,745 | 60,363 |
| - = No Data Reported; -- = Not Applicable; NA = Not Available; W = Withheld to avoid disclosure of individual company data. |
| Release Date: 6/30/2026 |
| Next Release Date: 7/31/2026 |