|
Download Data (XLS File) |
|
||||||||
|
||||||||
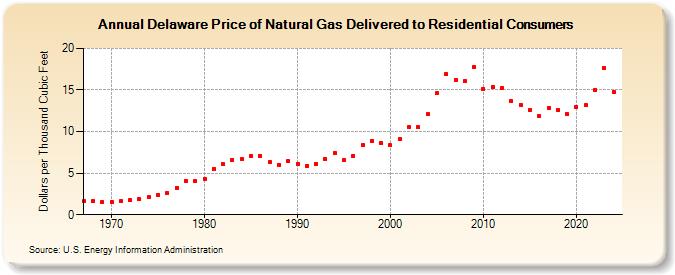
| Delaware Price of Natural Gas Delivered to Residential Consumers (Dollars per Thousand Cubic Feet) | ||||||||
| Decade | Year-0 | Year-1 | Year-2 | Year-3 | Year-4 | Year-5 | Year-6 | Year-7 | Year-8 | Year-9 |
|---|---|---|---|---|---|---|---|---|---|---|
| 1960's | 1.60 | 1.59 | 1.50 | |||||||
| 1970's | 1.58 | 1.63 | 1.71 | 1.85 | 2.11 | 2.43 | 2.61 | 3.25 | 4.06 | 4.03 |
| 1980's | 4.30 | 5.53 | 6.04 | 6.59 | 6.67 | 7.06 | 7.09 | 6.32 | 6.00 | 6.42 |
| 1990's | 6.13 | 5.86 | 6.13 | 6.70 | 7.43 | 6.60 | 7.12 | 8.36 | 8.90 | 8.63 |
| 2000's | 8.33 | 9.06 | 10.53 | 10.53 | 12.08 | 14.58 | 16.93 | 16.21 | 16.07 | 17.79 |
| 2010's | 15.12 | 15.38 | 15.24 | 13.65 | 13.21 | 12.62 | 11.88 | 12.84 | 12.60 | 12.10 |
| 2020's | 12.95 | 13.14 | 15.00 | 17.69 | 14.78 | 15.97 |
| - = No Data Reported; -- = Not Applicable; NA = Not Available; W = Withheld to avoid disclosure of individual company data. |
| Release Date: 6/30/2026 |
| Next Release Date: 7/31/2026 |