|
Download Data (XLS File) |
|
||||||||
|
||||||||
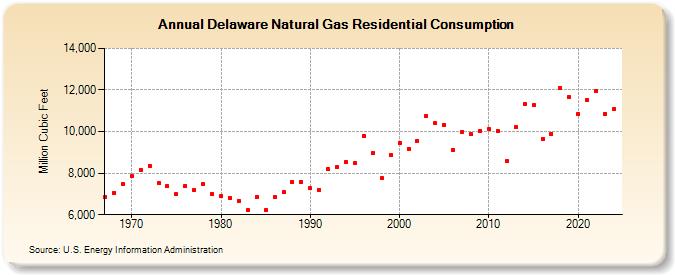
| Delaware Natural Gas Residential Consumption (Million Cubic Feet) | ||||||||
| Decade | Year-0 | Year-1 | Year-2 | Year-3 | Year-4 | Year-5 | Year-6 | Year-7 | Year-8 | Year-9 |
|---|---|---|---|---|---|---|---|---|---|---|
| 1960's | 6,844 | 7,068 | 7,475 | |||||||
| 1970's | 7,843 | 8,172 | 8,358 | 7,514 | 7,380 | 6,985 | 7,380 | 7,209 | 7,458 | 6,986 |
| 1980's | 6,910 | 6,807 | 6,677 | 6,219 | 6,855 | 6,210 | 6,861 | 7,074 | 7,586 | 7,595 |
| 1990's | 7,270 | 7,189 | 8,194 | 8,295 | 8,557 | 8,505 | 9,791 | 8,972 | 7,755 | 8,862 |
| 2000's | 9,467 | 9,175 | 9,550 | 10,766 | 10,399 | 10,339 | 9,111 | 10,000 | 9,875 | 10,049 |
| 2010's | 10,126 | 10,030 | 8,564 | 10,197 | 11,316 | 11,260 | 9,660 | 9,896 | 12,076 | 11,643 |
| 2020's | 10,851 | 11,524 | 11,941 | 10,857 | 11,058 | 13,455 |
| - = No Data Reported; -- = Not Applicable; NA = Not Available; W = Withheld to avoid disclosure of individual company data. |
| Release Date: 6/30/2026 |
| Next Release Date: 7/31/2026 |