|
Download Data (XLS File) |
|
||||||||
|
||||||||
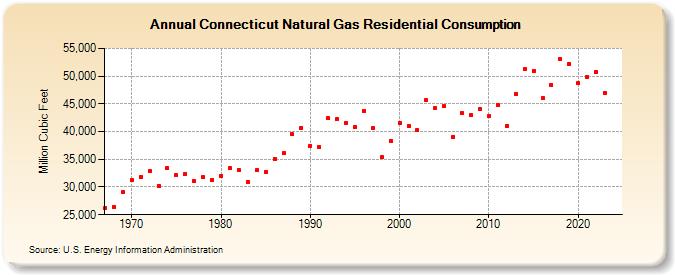
| Connecticut Natural Gas Residential Consumption (Million Cubic Feet) | ||||||||
| Decade | Year-0 | Year-1 | Year-2 | Year-3 | Year-4 | Year-5 | Year-6 | Year-7 | Year-8 | Year-9 |
|---|---|---|---|---|---|---|---|---|---|---|
| 1960's | 26,177 | 26,437 | 29,048 | |||||||
| 1970's | 31,187 | 31,878 | 32,879 | 30,261 | 33,417 | 32,143 | 32,310 | 31,069 | 31,800 | 31,285 |
| 1980's | 32,042 | 33,338 | 33,056 | 30,916 | 33,062 | 32,778 | 35,107 | 36,134 | 39,485 | 40,687 |
| 1990's | 37,446 | 37,181 | 42,394 | 42,213 | 41,600 | 40,824 | 43,764 | 40,562 | 35,329 | 38,364 |
| 2000's | 41,534 | 41,022 | 40,276 | 45,627 | 44,179 | 44,522 | 39,069 | 43,348 | 42,935 | 43,995 |
| 2010's | 42,729 | 44,719 | 41,050 | 46,802 | 51,193 | 50,975 | 46,045 | 48,431 | 53,100 | 52,228 |
| 2020's | 48,701 | 49,873 | 50,745 | 46,972 | 47,637 | 53,091 |
| - = No Data Reported; -- = Not Applicable; NA = Not Available; W = Withheld to avoid disclosure of individual company data. |
| Release Date: 6/30/2026 |
| Next Release Date: 7/31/2026 |