|
Download Data (XLS File) |
|
||||||||
|
||||||||
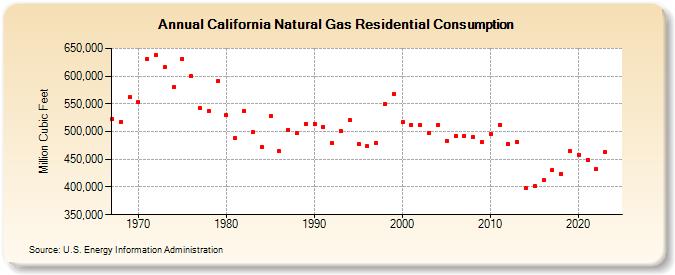
| California Natural Gas Residential Consumption (Million Cubic Feet) | ||||||||
| Decade | Year-0 | Year-1 | Year-2 | Year-3 | Year-4 | Year-5 | Year-6 | Year-7 | Year-8 | Year-9 |
|---|---|---|---|---|---|---|---|---|---|---|
| 1960's | 522,122 | 517,636 | 562,127 | |||||||
| 1970's | 552,544 | 630,998 | 637,289 | 615,719 | 580,009 | 631,398 | 599,631 | 541,728 | 537,412 | 590,732 |
| 1980's | 529,342 | 488,353 | 537,194 | 498,601 | 472,151 | 527,495 | 464,307 | 503,473 | 497,138 | 514,276 |
| 1990's | 514,507 | 508,697 | 479,537 | 500,968 | 520,959 | 477,495 | 473,310 | 478,904 | 549,931 | 568,496 |
| 2000's | 516,730 | 512,695 | 510,995 | 497,955 | 512,046 | 483,699 | 491,777 | 492,378 | 489,304 | 480,721 |
| 2010's | 494,890 | 512,565 | 477,931 | 481,773 | 397,489 | 401,172 | 411,828 | 431,005 | 423,915 | 464,672 |
| 2020's | 458,498 | 449,311 | 432,636 | 463,343 | 419,503 | 408,468 |
| - = No Data Reported; -- = Not Applicable; NA = Not Available; W = Withheld to avoid disclosure of individual company data. |
| Release Date: 7/31/2026 |
| Next Release Date: 8/31/2026 |