|
Download Data (XLS File) |
|
||||||||
|
||||||||
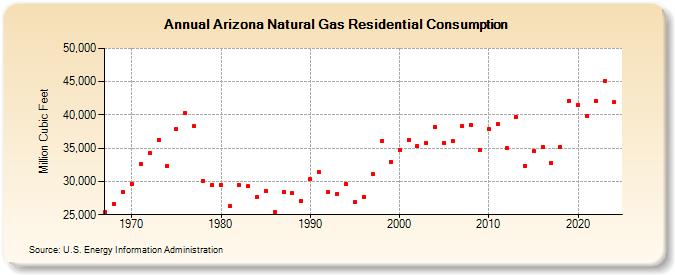
| Arizona Natural Gas Residential Consumption (Million Cubic Feet) | ||||||||
| Decade | Year-0 | Year-1 | Year-2 | Year-3 | Year-4 | Year-5 | Year-6 | Year-7 | Year-8 | Year-9 |
|---|---|---|---|---|---|---|---|---|---|---|
| 1960's | 25,376 | 26,681 | 28,426 | |||||||
| 1970's | 29,679 | 32,619 | 34,259 | 36,280 | 32,335 | 37,931 | 40,267 | 38,286 | 30,115 | 29,538 |
| 1980's | 29,518 | 26,298 | 29,449 | 29,255 | 27,606 | 28,634 | 25,412 | 28,426 | 28,206 | 27,084 |
| 1990's | 30,320 | 31,353 | 28,386 | 28,161 | 29,684 | 26,893 | 27,709 | 31,057 | 36,100 | 32,940 |
| 2000's | 34,740 | 36,249 | 35,305 | 35,810 | 38,206 | 35,767 | 36,055 | 38,321 | 38,453 | 34,732 |
| 2010's | 37,812 | 38,592 | 34,974 | 39,692 | 32,397 | 34,516 | 35,120 | 32,821 | 35,125 | 42,085 |
| 2020's | 41,515 | 39,828 | 42,164 | 45,066 | 41,311 | 38,306 |
| - = No Data Reported; -- = Not Applicable; NA = Not Available; W = Withheld to avoid disclosure of individual company data. |
| Release Date: 6/30/2026 |
| Next Release Date: 7/31/2026 |