Back to Methodology
How We Chose Buildings for the 2018 CBECS
Release date: June 20, 2019
Revised Date: April 12, 2023
We estimated that 5.9 million commercial buildings existed in the United States in 2018. Because conducting an interview at every one of these buildings would be impractical and prohibitively expensive, we used a probability sample to represent the entire population. To select a statistically valid sample that will produce accurate statistics about the commercial buildings population, each building must have one and only one chance (probability) of selection, and the probability must be known. To make this selection, a sampling frame, or list of commercial buildings, must be created.
No comprehensive list of U.S. commercial buildings currently exists, so we must construct our own sampling frame. Most of this sampling frame is called the area frame portion, which is composed of all commercial buildings in selected geographic areas. In each selected geographical area, trained staff record information about every commercial building, either in person, by walking or driving the entire selected areas, or virtually, using a Geographic Information Systems (GIS) web-based tool. The other part of the sampling frame is called the list frames portion and is composed of five different lists of large buildings. The multi-frame approach ensures that all types and sizes of commercial buildings have a chance of selection, and it allows for more efficient sampling of larger buildings associated with higher energy use. More detailed descriptions of the frame types are provided in the sections below.
The area frame
The area frame construction is the most time-consuming and expensive step of the CBECS frame-building process, but it is a well-established method that ensures the frame covers all commercial buildings in the selected areas of the United States. Trained listers canvas geographical areas in person or virtually and record all commercial buildings. It is not feasible within our budget to record every commercial building in the entire country for the area frame, so the country is divided into smaller, more manageable areas that each had a chance of selection. This approach is called multi-stage area probability sampling.
The first level of geography in the multi-stage area probability sample is called a primary sampling unit (PSU), which consists of a county or group of counties. For the 2018 CBECS as well as the 2012 CBECS, we divided the United States into 687 PSUs. A measure of commercial business activity within each PSU was estimated using the U.S. Census Bureau’s County Business Patterns dataset. This measure of business activity is highly correlated with the number of commercial buildings, so it was used as a measure of size to select PSUs with a method called probability proportionate to size (PPS) sampling. The PSUs that included major cities or metropolitan areas with substantial commercial activity were selected with certainty, while other PSUs were randomly selected with probabilities reflecting their measure of size. From a total of 687 PSUs, 151 were selected.
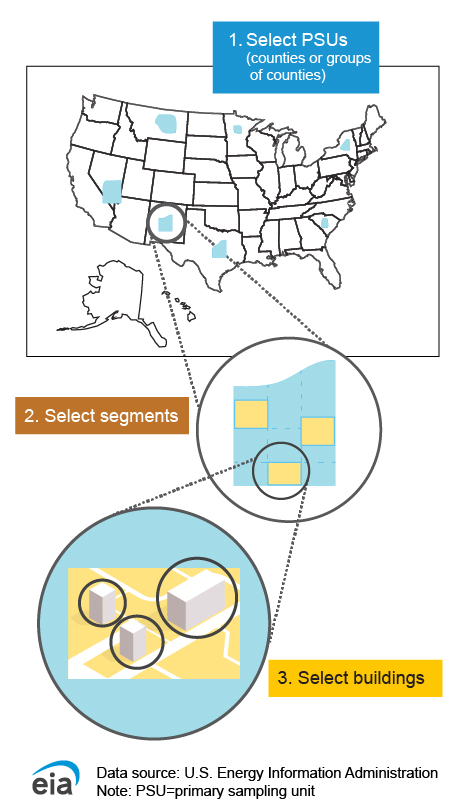
The 151 selected PSUs were then divided further into the second level of geography in the multi-stage area probability sample: secondary sampling units (SSUs, also referred to as segments). SSUs are composed of census tracts or groups of census tracts. In the 2018 CBECS, the 151 selected PSUs contained 8,559 SSUs; 764 of the 8,559 SSUs were sampled using a PPS sample, in which an estimate of the number of commercial buildings was used to represent the size.1
The final stage of frame construction was the listing of buildings in the 764 sampled segments. In previous CBECS surveys, the only available method for identifying buildings in the sampled segments was field listing, where trained field staff walked every block in the segment (or drove in more suburban or rural areas) and wrote down the name, address, and other descriptive information about all commercial buildings within the designated segment boundaries. The 2018 CBECS introduced a new listing technique called virtual listing. The web-based Virtual Listing System (VLS) incorporates GIS, satellite imagery, points of interest (such as schools, libraries, airports, grocery stores, and restaurants), and other commercial databases. The VLS allows staff to list buildings without physically traveling to the building locations, saving time and money compared with the traditional field listing method. Virtual Listing in the 2018 CBECS provides a more in-depth discussion of the VLS.
Because virtual listing was new to CBECS, EIA conducted a test in 59 segments before the main listing period. These 59 segments were listed two ways, using traditional field methods and the VLS, and the lists from the two methods were compared. The results of the test, described in detail in Virtual Listing in the 2018 CBECS, showed that virtual listing was successful in listing commercial buildings in terms of quality, coverage, time savings, and cost savings. As a result, most of the remaining 705 segments were listed virtually with the VLS. A small number (26 segments) did not have adequate satellite coverage to be listed virtually, so they had to be field listed. The 2018 CBECS area frame included approximately 256,000 commercial buildings from a combination of field and virtual listing.2
The list frames
Large buildings are sampled at higher rates than small buildings because of the relatively large amount of energy consumed in these buildings—square footage is highly correlated with energy consumption. However, sampling only from the area frame would not provide a sufficient number of large buildings.
To compensate for this limitation of the area sample, special lists of buildings larger than 200,000 square feet were used to augment the area frame. Five administrative database lists were used: hospitals, federal buildings, airports, college campus buildings, and other large buildings such as offices, hotels, and shopping malls. We obtained or purchased these lists from organizations such as government agencies and trade associations and then processed them for the purposes of sampling. Because a given building could be listed in more than one frame, the samples selected independently from each of these frames were subsequently de-duplicated using a protocol that allows such duplicates a single path into the sample, which ensures that a building has only one chance of selection. After data cleaning and de-duplication, the compilation of these lists provided sufficient coverage of large, energy-intensive buildings. The 2018 CBECS list frames included about 23,000 buildings.
Drawing a sample from the frames
The area frame and list frames were combined to form the final 2018 CBECS building sampling frame. In selecting the buildings, the goal was to optimize sample accuracy for overall cost. Using the information on the sampling frame, the buildings were sorted into subgroups with similar qualities by sampling frame, PSU, SSU, building size, and building type. The number of sampled buildings within each subgroup was calculated to minimize the variance of estimated energy consumption. These calculations are subject to total sample size and overall budget constraints. Subgroups that have a highly variable total energy consumption (large buildings) were sampled at a higher rate than subgroups with less variable energy consumption.
Each sampled building is assigned a weight, called a base weight, which is equal to one divided by the probability of selection. This weight is the number of buildings in the population that the building represents (including itself and other similar non-sampled buildings). The base weights are adjusted to account for buildings in the sample that turn out to be ineligible and to represent buildings that did not respond to the survey. The estimated total number of commercial buildings is calculated by adding up the adjusted base weights of all the buildings in the sample.
In March 2019, a sample of about 16,000 buildings was selected from the frame for the 2018 CBECS.
Endnotes
1The number of commercial buildings in each SSU was estimated using a purchased file of commercial establishments.
2The 2012 area frame included approximately 228,000 buildings. The increase in number of buildings on the frame is likely a combination of growth in the building stock since 2012 and the improved ability of the VLS to identify buildings.
Contact Joelle Michaels if you have questions or would like more detailed information.


