AEO2022 Issues in Focus: Exploration of the No Interstate Natural Gas Pipeline Builds case

Executive Summary
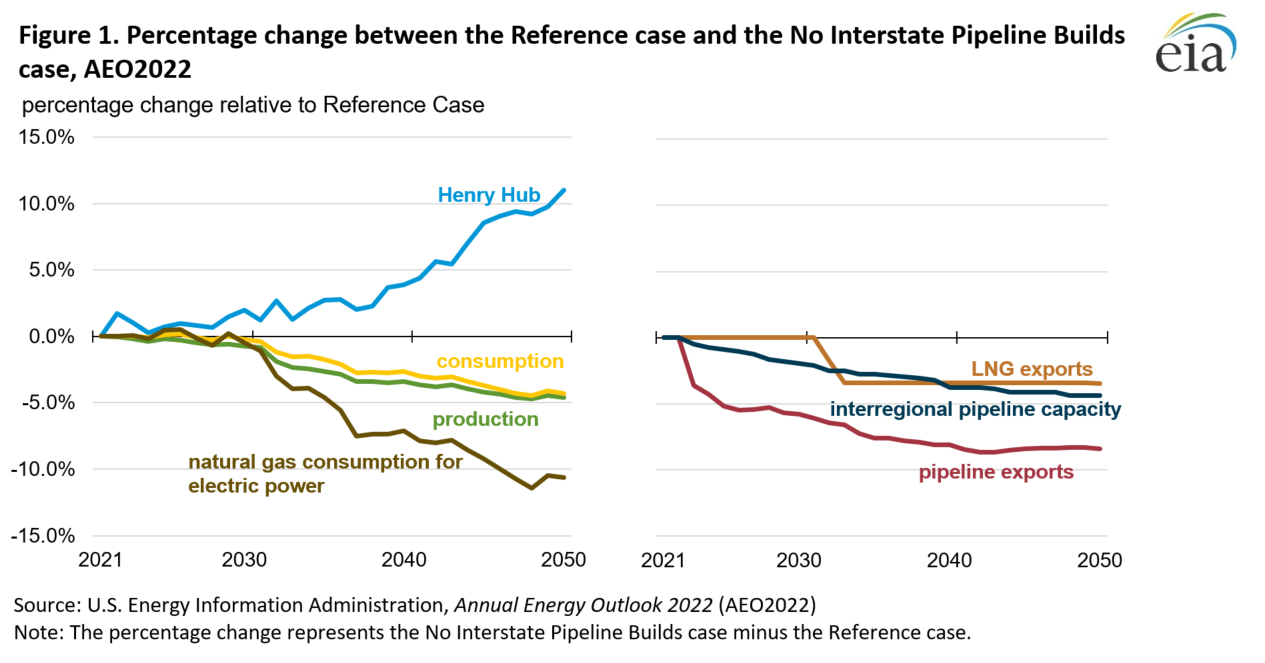
In addition to the Reference case and side cases in our Annual Energy Outlook 2022 (AEO2022), we created a case that explores what happens if no additional interstate natural gas pipelines are built between 2024 and 2050, the No Interstate Pipeline Builds case. In this case, we project 4.6% less natural gas production and 4.3% less natural gas consumption in 2050 compared with the Reference case. In addition, our projected 2050 spot price at the Henry Hub is 11.0% higher than in the Reference case. We find that not building interstate natural gas pipelines affects some regions significantly more than others. We found the East North Central,1 Middle Atlantic,2 and South Atlantic3 regions were the most sensitive to changes in pipeline capacity because of limitations to growth in production in the Appalachia Basin (Appendix 1).
Market overview
Between 1990 and 2020, U.S. interstate natural gas pipeline capacity grew considerably, increasing by nearly an estimated 300 billion cubic feet per day (Bcf/d) over that period, according to our state-to-state capacity tracker. The increase in natural gas pipeline capacity has accommodated and prompted growth in natural gas production, allowing additional natural gas volumes to reach sectors with growing natural gas consumption, such as natural gas exports and natural gas-fired electric power generation.
However, natural gas pipeline projects have come under increased scrutiny in recent years. Over the past few years, several large, interstate natural gas pipeline projects (such as the Atlantic Coast Pipeline, the Penn East Pipeline, and the Constitution Pipeline) have been cancelled following heightened legal and public pressure. In addition, in March 2021, the Federal Energy Regulatory Commission (FERC), which regulates interstate pipelines, announced that it would commit to considering greenhouse gas emissions and their contributions to climate change when assessing a proposed natural gas pipeline project’s environmental impact.
Methodology
Because of growing interest in natural gas pipelines due to in part to legal and public pressures, we developed the AEO2022 No Interstate Pipeline Builds case to assess the potential impacts to the energy sector of a possible permanent moratorium on new natural gas pipeline builds.
The modeling in the No Interstate Pipeline Builds case assumes no unplanned interstate natural gas pipeline capacity will be added between 2024 and 2050. In our AEO2022 forecasts, we add unplanned natural gas pipeline capacity endogenously after the model determines it is economical to do so. Before 2024, our modeling incorporates natural gas pipeline projects that are already approved or under construction into interstate pipeline capacities based on projects published on our Natural Gas Pipeline Projects Tracker.4,5 We chose the year 2024 because some pipeline projects already are approved by regulators and are under construction with target in-service dates in 2023. This timeframe also aligns with the Reference case, which also begins to incorporate unplanned capacity expansions starting in 2024. The No Interstate Pipeline Builds case assumes new pipeline capacity will be restricted and additional capacity to reverse flows on existing pipelines will be prevented; we assume all planned or existing bi-directional capacity remains the same as in the Reference case.
Results
National overview
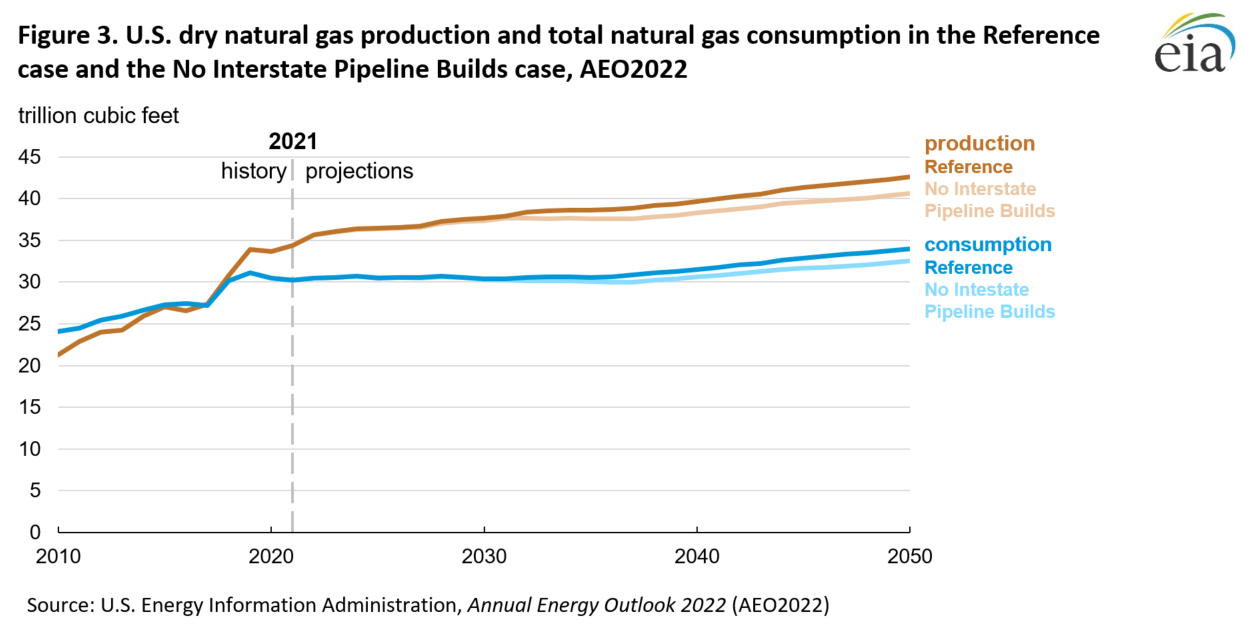
Restricting interstate natural gas pipeline builds results in an interregional capacity of 163.0 Bcf/d in 2050, which is 7.4 Bcf/d less than the Reference case projection (Table 1). Fewer pipeline builds in the No Interstate Pipeline Builds case results in nearly 2.0 trillion cubic feet (Tcf) less dry natural gas produced in 2050 compared with the Reference case.
Table 1. Summary of national results for select years in the Reference case and the No Interstate Pipeline Builds case, AEO2022
| Case | 2021 | 2030 | 2040 | 2050 | Change relative to 2021 | Percentage change relative to 2021 |
|---|---|---|---|---|---|---|
| Reference case | ||||||
| Henry Hub price (2021$/MMBtu) | 4.11 | 3.46 | 3.72 | 3.59 | -0.52 | -12.6% |
| Dry natural gas production (Tcf) | 34.4 | 37.6 | 39.6 | 42.6 | 8.2 | 23.8% |
| Natural gas consumption (Tcf) | 30.3 | 30.4 | 31.5 | 34 | 3.8 | 12.5% |
| Natural gas used for electric power (Tcf) | 10.9 | 9.9 | 10.2 | 11.5 | 0.6 | 5.6% |
| Natural gas pipeline exports (Tcf) | 3.2 | 3.6 | 3.9 | 3.9 | 0.7 | 22.6% |
| Liquefied natural gas exports (Tcf) | 3.6 | 5.4 | 5.9 | 5.9 | 2.3 | 63.8% |
| Interregional pipeline capacity (Bcf/d) | 160.9 | 166.3 | 169 | 170.5 | 9.6 | 5.9% |
| No Interstate Pipeline Builds case | ||||||
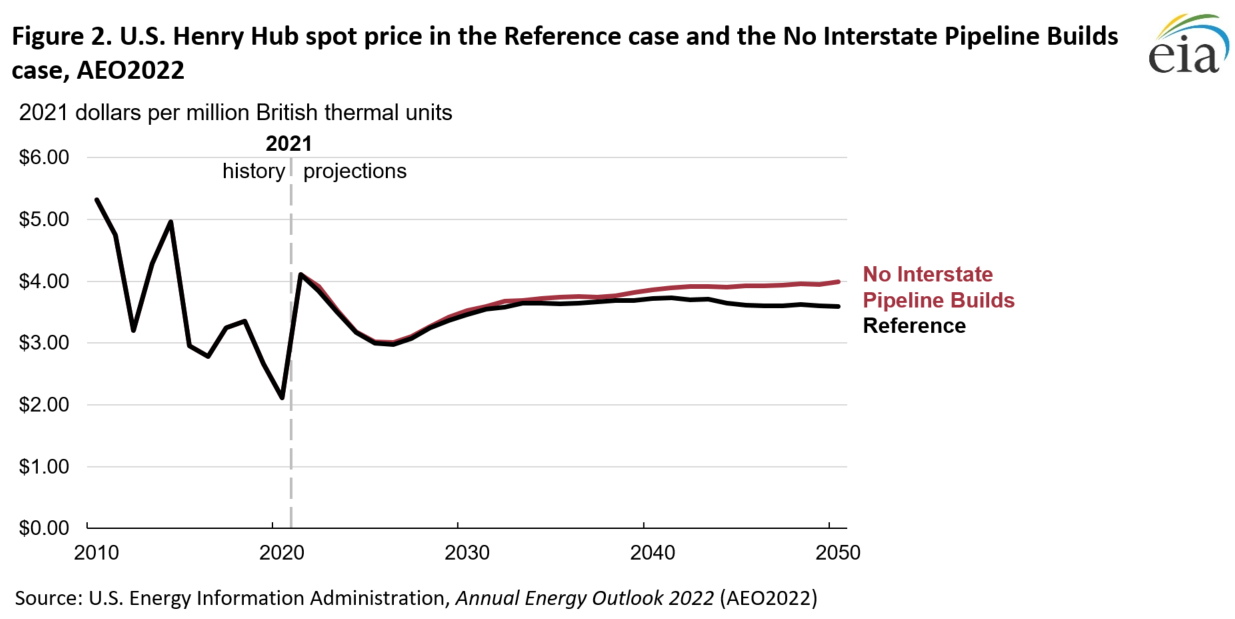
| Henry Hub price (2021$/MMBtu) | 4.11 | 3.53 | 3.86 | 3.99 | -0.12 | 3.0% |
| Dry natural gas production (Tcf) | 34.4 | 37.3 | 38.3 | 40.6 | 6.2 | 18.1% |
| Natural gas consumption (Tcf) | 30.2 | 30.3 | 30.6 | 32.6 | 2.3 | 7.6% |
| Natural gas used for electric power (Tcf) | 10.9 | 9.8 | 9.4 | 10.3 | -0.6 | -5.5% |
| Natural gas pipeline exports (Tcf) | 3.2 | 3.4 | 3.6 | 3.6 | 0.4 | 12.3% |
| Liquefied natural gas exports (Tcf) | 3.6 | 5.4 | 5.7 | 5.7 | 2.1 | 58.1% |
| Interregional pipeline capacity (Bcf/d) | 160.9 | 163 | 163 | 163 | 2.1 | 1.3% |
Supply, demand, and prices
The No Interstate Pipeline Builds case projects that the Henry Hub spot price reaches nearly $4.00 per million British thermal units (MMBtu) in 2050, which is $0.40/MMBtu higher than in the Reference case. This projection results from lower natural gas supply and higher variable tariff rates for natural gas transportation because of increased pipeline capacity utilization.
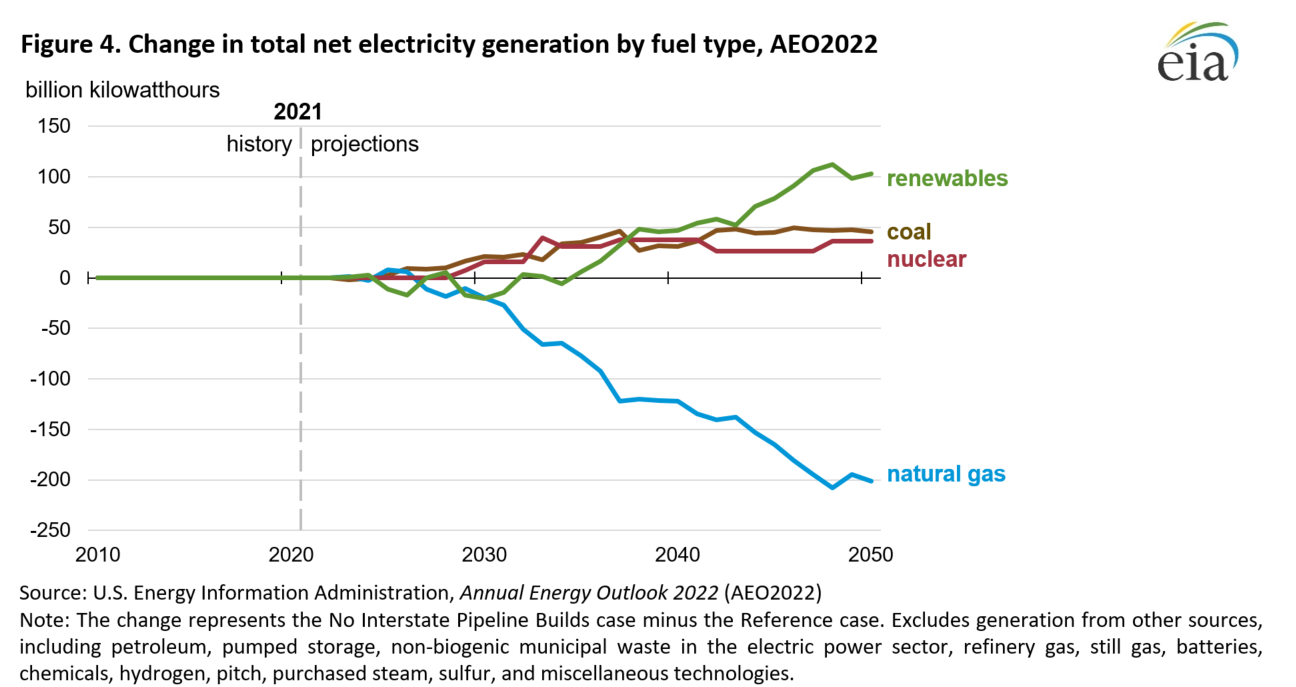
Natural gas consumption in 2050 in the No Interstate Pipeline Build case is 4.3% lower than in the Reference case. Most of the difference results from less natural gas consumption in the electric power sector, which we project to be about 1.2 Tcf lower by 2050 than in the Reference case. Higher natural gas prices in the No Interstate Pipeline Builds case make natural gas a less economical fuel for electric power generation compared with alternative sources, such as coal or renewables.
We project 201 billion kilowatthours (BkWh), or 10.8%, less natural gas-fired generation in 2050 in the No Interstate Pipeline Builds case compared with the Reference case. In 2050, natural gas’s share of U.S. electricity generation falls from 34.1% in the Reference case to 30.5% in the No Interstate Pipeline Builds case. Different fuel sources combine to make up for the lower level of natural gas-fired generation. Generation from renewable sources is 103 BkWh higher, coal-fired generation is 46 BkWh higher, and nuclear powered generation is 36 BkWh higher in 2050 compared with the Reference case.
Although our projected Henry Hub spot price remains low enough to lead growth in natural gas exports through 2050, we project that restricting interstate natural gas pipeline builds will decrease natural gas exports in 2050 by nearly 0.5 Tcf relative to the Reference case. Higher natural gas prices in the No Interstate Pipeline Builds case make domestically produced natural gas slightly less competitive internationally compared with the Reference case. We project that natural gas pipeline exports to Canada and Mexico combined will be 0.3 Tcf lower by 2050 compared with the Reference case, and we project liquefied natural gas (LNG) exports to be lower by 0.2 Tcf.
Energy-related CO2 emissions
We project restricted interstate natural gas pipeline capacity will only slightly lower energy-related carbon dioxide (CO2) emissions in the United States. In the No Interstate Pipeline Builds case, the amount of CO2 emitted from natural gas combustion in 2050 is 1,748 million metric tons (MMmt), about 80 MMmt (4.4%) lower compared with the Reference case. Almost all of the difference comes from natural gas-related CO2 emissions in the electric power sector, which we project to be 561 MMmt, or 10.6%, lower than the Reference case in 2050.
However, total CO2 emissions from all fuel sources are only 34 MMmt (0.7%) lower in the No Interstate Pipeline Builds case than in the Reference case in 2050. The relatively small difference in CO2 emissions from all fuel sources partly results from higher levels of coal-fired power generation, which is more carbon intensive than the natural gas-fired generation it displaces. Although consumption of natural gas to generate electricity is sensitive to natural gas prices, by contrast, residential, commercial, and industrial use, which together make up over 60% of natural gas-related CO2 emissions, are relatively insensitive to natural gas prices. CO2 emissions from natural gas use in the commercial, industrial, and residential sectors were lower by 1.5% or less from levels in the Reference case, leaving total CO2 emissions in the No Interstate Pipeline Builds case less than 1% lower.
Regional impacts
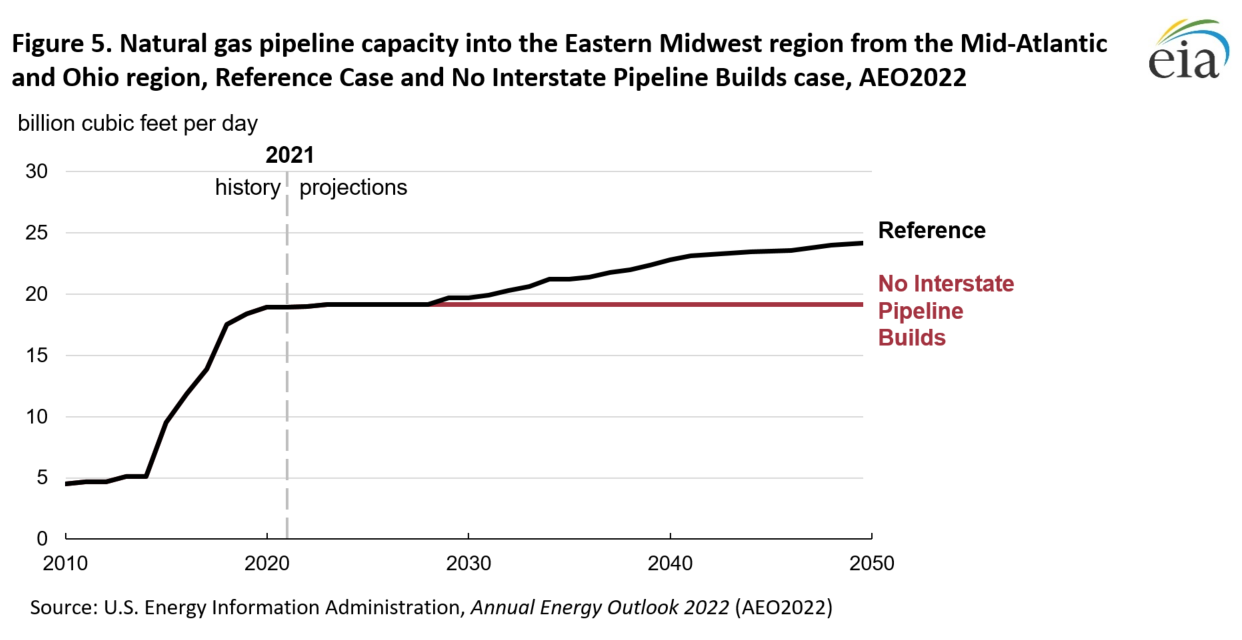
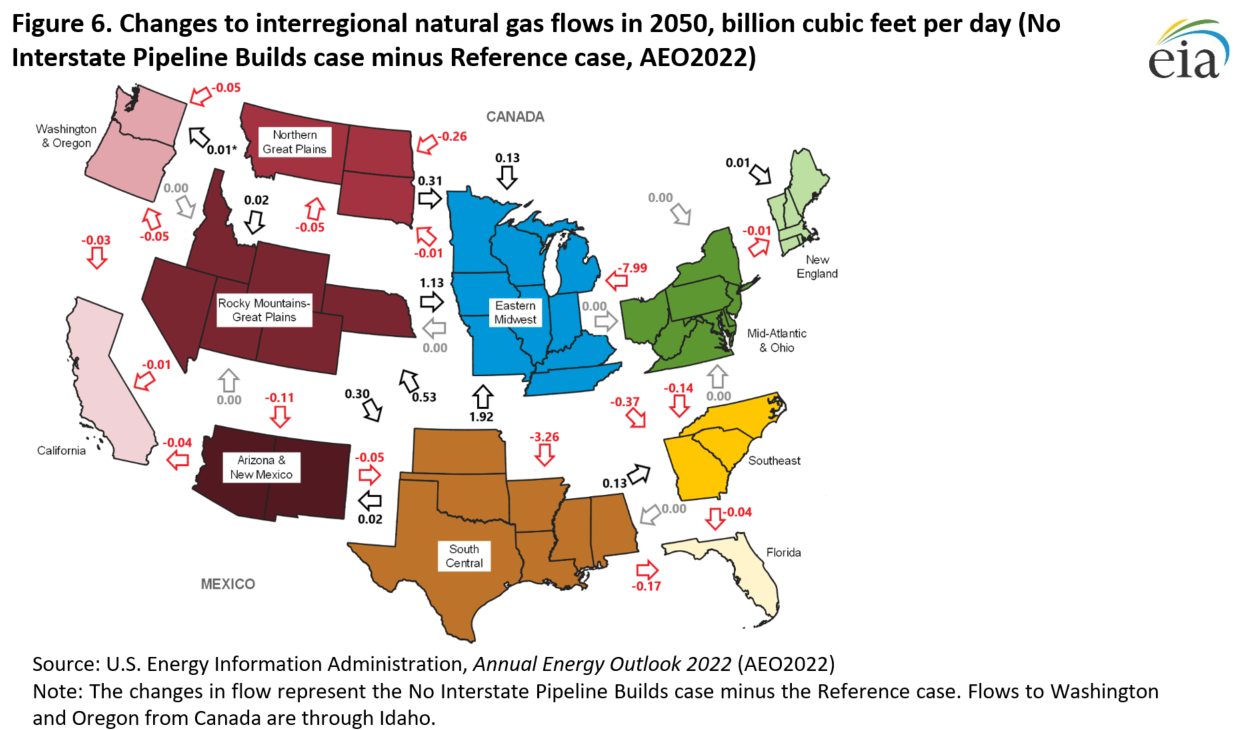
In the Reference case, most interregional natural gas pipeline capacity expands capacity out of the Mid-Atlantic and Ohio natural gas region to demand areas such as the Eastern Midwest (Appendix 2). New pipelines accommodate additional supply volumes from the Appalachia natural gas production area, and almost all of the capacity additions are built after the late-2020s. Restricting unplanned interstate pipeline builds after 2023 results in 5.1 Bcf/d less capacity from the Mid-Atlantic and Ohio region to the Eastern Midwest region by 2050. Although other interregional pipeline capacity builds are also affected, the impact is not as great as prohibiting new infrastructure between the Mid-Atlantic and Ohio region and the Eastern Midwest region because the Reference case builds less new capacity between these other regions. Other differences between the No Interstate Pipeline Builds case and the Reference case include 1.1 Bcf/d less capacity into the Eastern Midwest region from the Northern Great Plains region, 0.7 Bcf/d less capacity from the Eastern Midwest region into the Southeast region, and 0.05 Bcf/d less capacity into the New England region from Canada.
Interregional pipeline capacity between the Eastern Midwest and the South Central regions is not affected in the No Interstate Pipeline Builds case. However, natural gas flows between these two regions increase significantly compared with the Reference case to partly make up for the more limited natural gas flows going into the Eastern Midwest region from the Mid-Atlantic and Ohio region. In the Reference case, by 2050, the Eastern Midwest region exports more natural gas to the South Central region than it imports from the South Central region. However, in the No Interstate Natural Gas Builds case, the Eastern Midwest region imports more natural gas from the South Central region than it exports. The net South Central-to-Eastern Midwest region flows increase by 1.3 Bcf/d in 2050 compared with the Reference case.
Production
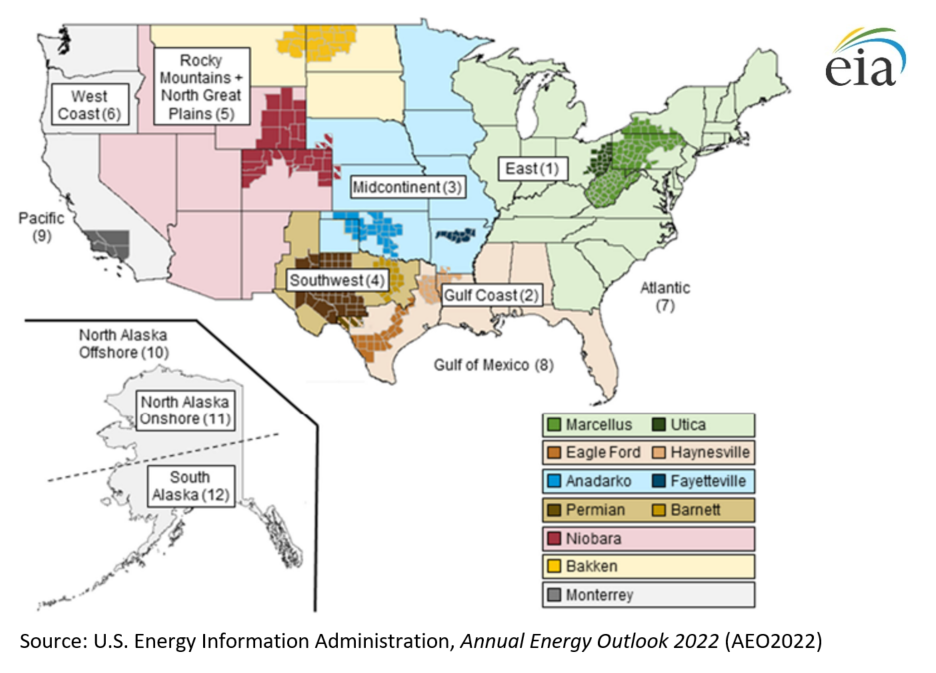
Most of the nearly 2.0 Tcf difference in dry U.S. natural gas production in 2050 between the No Interstate Pipeline Builds case and the Reference case is due to lower levels of dry natural gas production in the oil and natural gas East supply region, which includes the Marcellus and Utica shale plays (Appendix 3). Compared with the Reference case, the East region produces 3.6 Tcf less dry natural gas by 2050 in the No Interstate Pipeline Builds case. Restricting new pipeline capacity leads to takeaway capacity constraints out of the region, effectively capping production increases beyond that level. However, dry natural gas production in other regions is slightly higher. As a result, less natural gas production in the East is partly offset by more dry natural gas production in the Gulf Coast and the Southwest, 0.7 Tcf and 0.4 Tcf, respectively, by 2050 compared with the Reference case.
Prices
Although we project that restricting interstate natural gas pipeline builds leads to a relatively higher Henry Hub spot price, we expect that regional delivered end-use prices, which are a function of the Henry Hub spot price plus a distribution markup, vary widely. In the No Interstate Pipeline Builds case, we project that the only region where natural prices are lower than in the Reference case is in the Middle Atlantic Census Division, where average delivered end-use prices are $0.69/MMBtu lower by 2050 compared with the Reference case (Appendix 1). The lack of natural gas takeaway capacity out of the Appalachia Basin results in an excess of natural gas supply in the Mid-Atlantic. Average delivered end-use prices are higher in almost every other census division. The largest difference occurs in the East North Central Census Division, where we project average delivered end-use prices to be about $1.25/MMBtu higher by the end of the projection period compared with the Reference case. Less incoming natural gas produced from the Appalachia Basin decrease natural gas supply available for that census division.
Consumption
Because of generally higher natural gas prices, we project that consumption in most census divisions will be lower in the No Interstate Pipeline Builds case relative to the Reference case, primarily resulting from less natural gas consumed by the electric power sector. We project that consumption in the East North Central Census Division and South Atlantic Census Division will be lower by about 1.0 Tcf (15.9%) and 0.5 Tcf (13.3%) by 2050, respectively, compared with the Reference case. However, in the Middle Atlantic Census Division, we project that consumption will be 0.6 Tcf (17.8%) higher as lower prices in the Middle Atlantic Census Division lead to more natural gas consumption in the electric power sector.
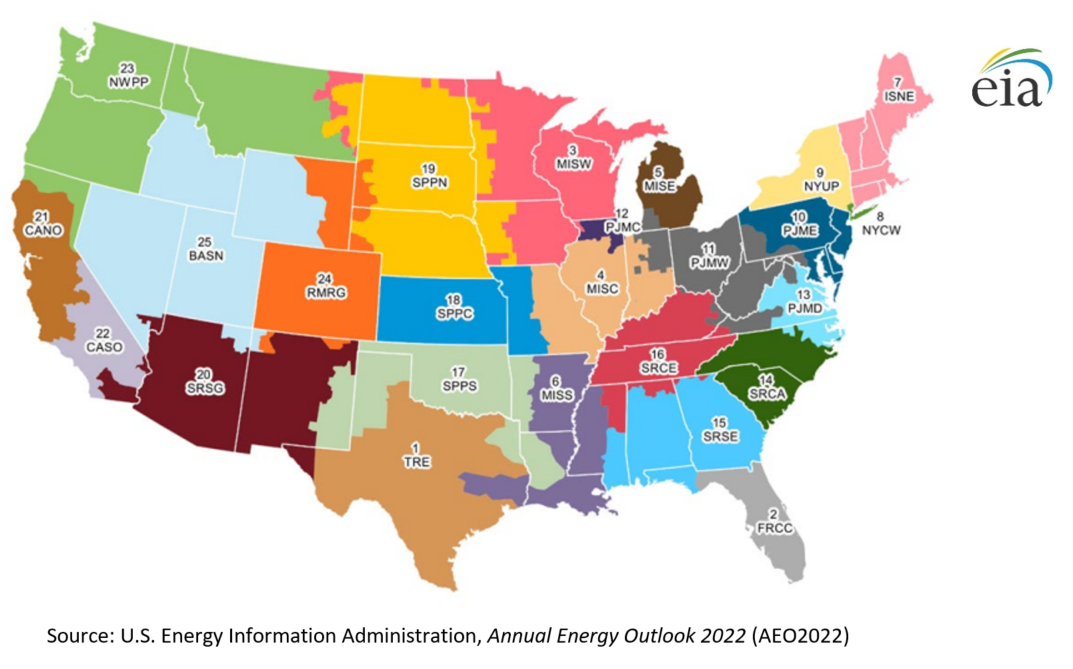
These changes in natural gas consumption for the electric power sector ultimately result in changes to the electricity generation mix at a regional balancing authority level. In many of the large Electricity Market Module (EMM) regions, such as the PJM Interconnection (PJM) and the Texas Reliability Entity, coal and nuclear power generation primarily replace the lower levels of natural gas-fired generation. This shift occurs because fewer coal and nuclear power plants retire in this case (Appendix 4). The primary exception is in the Midcontinent Independent System Operator (MISO), where wind and solar replace almost all of the natural gas-fired generation.
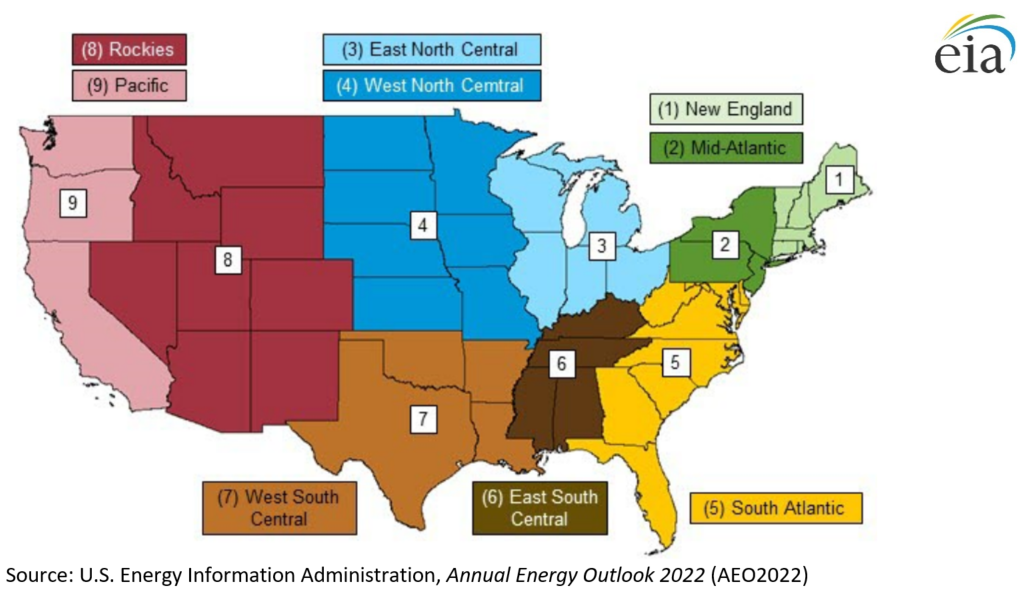
Appendix 1. NGMM Demand Regions, Based on Census Regions and Divisions
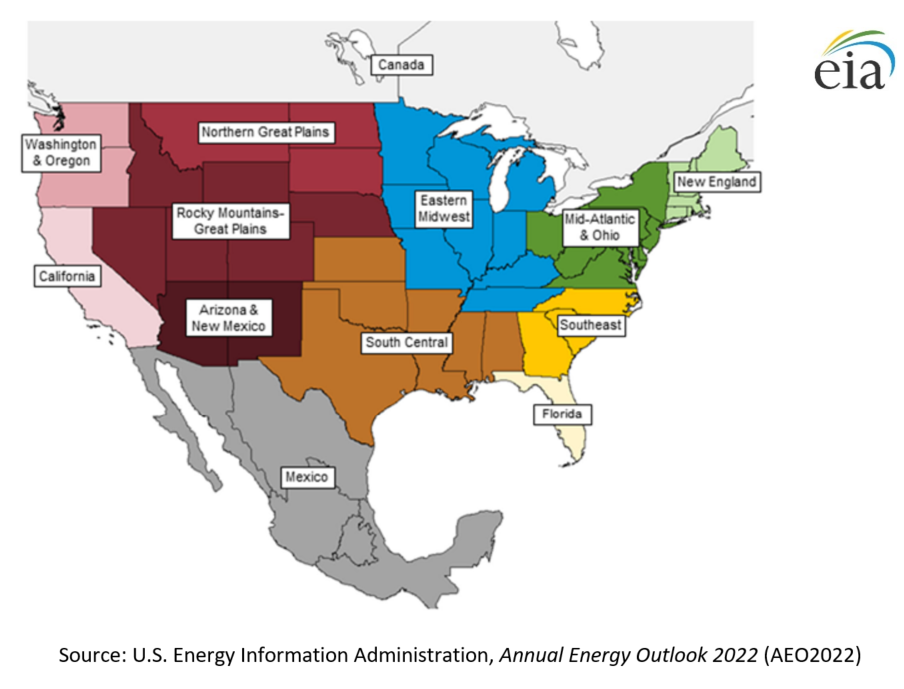
Appendix 2. Natural Gas Regions Used to Report Regional Flows and Capacity
Appendix 3. NEMS Oil and Natural Gas Supply Regions and Corresponding Tight Oil and Shale Gas Regions
Appendix 4. Electricity Market Module Supply Regions
1 - Texas Reliability Entity (TRE)
2 - Florida Reliability Coordinating Council (FRCC)
3 - Midcontinent ISO/West (MISW)
4 - Midcontinent ISO/Central (MISC)
5 - Midcontinent ISO/East (MISE)
6 - Midcontinent ISO/South (MISS)
7 - Northeast Power Coordinating Council/New England (ISNE)
8 - Northeast Power Coordinating Council/New York City and Long Island (NYCW)
9 - Northeast Power Coordinating Council/Upstate New York (NYUP)
10 - PJM/East (PJME)
11 - PJM/West (PJMW)
12 - PJM/Commonwealth Edison (PJMC)
13 - PJM/Dominion (PJMD)
14 - SERC/East (SRCA)
15 - SERC/Southeast (SRSE)
16 - SERC/Central (SRCE)
17 - Southwest Power Pool/South (SPPS)
18 - Southwest Power Pool/Central (SPPC)
19 - Southwest Power Pool/North (SPPN)
20 - Western Electricity Coordinating Council/Southwest (SRSG)
21 - Western Electricity Coordinating Council/California North (CANO)
22 - Western Electricity Coordinating Council/California South (CASO)
Footnotes
- Includes Illinois, Indiana, Michigan, Ohio, and Wisconsin.
- Includes Pennsylvania, New Jersey, and New York.
- Includes Delaware, the District of Columbia, Florida, Georgia, Maryland, North Caroline, South Carolina, Virginia, and West Virginia.
- We assume all projects enter service in November of their expected year in service, consistent with the historical tendency of projects to begin service before the start of peak winter demand.
- Using the Natural Gas Pipeline Tracker data published in October 2021.