Issues in Focus: Inflation Reduction Act Cases in the AEO2023

Executive Summary
The Annual Energy Outlook 2023 (AEO2023) reflects, to the extent possible, laws and regulations adopted through mid-November 2022, including the Inflation Reduction Act (IRA). Adopted in August 2022, the IRA is a complex piece of legislation that requires us to make assumptions regarding how key provisions will be implemented. Under the IRA, qualifying clean energy projects can receive additional credits on top of a base credit value if they satisfy certain requirements. For instance, clean energy technologies that meet minimal eligibility requirements receive a base-level production tax credit (PTC). Projects meeting labor requirements receive a tax credit five times higher than the base amount. Additional increases to the base tax credit are available for projects that meet domestic content requirements or are located in energy communities, which are defined as former brownfield sites, areas with above-average unemployment rates, or areas that rely on fossil fuel industries for employment or tax revenue.
This report assesses changes to the energy system and U.S. energy-related carbon dioxide (CO2) emissions due to IRA implementation, holding other assumptions constant. To meet this objective, we assess the effects of the IRA by comparing the Reference case, which includes IRA provisions, against a case that excludes all IRA provisions. The Reference case reflects our view of the most likely tax credit uptake, and it assumes qualified technologies receive the base tax credit and some bonus credits. In the Reference case, we assume all eligible technologies in the electric power sector fulfill the labor requirements. We also assume certain grid-scale technologies, such as new wind projects, fulfill the labor and the domestic content requirements. The No IRA case is a comparison against the Reference case and assumes the same economic, technology characteristics, and market outlooks.
To address some of the uncertainty around IRA provisions, we present two additional cases with variations of certain tax credits and incentives applied to eligible technologies that explore the IRA’s range of impacts. In the Low Uptake case, we assume most qualified technologies receive the same or fewer credits than in the Reference case, and, in the High Uptake case, they receive the same or more credits. The Low Uptake and High Uptake cases form the lower and upper bounds of the IRA provisions’ impact. We provide additional details in the Appendix.
In this analysis, we found that assumptions around the bonus credits have a substantial impact on the results. In particular, the Low Uptake case produces results that are similar to the No IRA case, indicating that the IRA base credits alone are unlikely to have an appreciable impact on the U.S. energy system. By contrast, as highlighted in the results presented in this report, the Reference and High Uptake cases often produce significant differences compared with the No IRA case.
We use 2005 as an emissions reference year because the United States’ nationally determined contribution (NDC), submitted as part of the Paris Agreement, calls for a target of 50% to 52% of net greenhouse gas emissions below the 2005 level by 2030. It is important to note, however, that we only consider energy-related CO2 emissions, which does not cover the full NDC scope. We report emissions reductions in 2030, but generally focus on results to 2050, to show the effect of the IRA through the end of the model time horizon. In the No IRA and Low Uptake cases, U.S. CO2 emissions fall 26% and 27%, respectively, by 2030 from 2005. The Reference and High Uptake cases go further and reach reductions of about 33% and 34%, respectively. By 2050, the No IRA and Low Uptake cases reach a 28% reduction below 2005 levels compared with 34% in the Reference case and about 35% High Uptake case.
The emissions decline comes because carbon-free resources provide more electricity by 2050 than coal and natural gas. IRA provisions in the Reference case push wind and solar to 56% of electricity generation by 2050, and, in the Low and High Uptake cases, the range is 41% to 59% when varying the bonus provisions. As more renewables are deployed, electricity generation from coal declines, which, in turn, lowers coal production in 2050 to 269 million short tons (MMst) in the Reference case and to 249 MMst in the High Uptake case. These 2050 levels are 25% to 31% lower compared with the No IRA and Low Uptake cases.
Natural gas production grows through 2050 in all cases, primarily to meet global demand. Across the three IRA cases (High Uptake, Low Uptake, and No IRA), natural gas production ranges from about 1% to 5% lower in the Low and High Uptake cases compared with the No IRA case. Liquefied natural gas (LNG) exports grow in all cases but particularly in the Reference and High Uptake cases because of reduced natural gas demand for power generation and relatively low domestic natural gas prices, which support wider spreads between domestic and international LNG prices.
The IRA tends to accelerate the electric vehicle (EVs) deployment over the next decade (Figure 6).1 In 2030, for example, the share of EV sales jumps from 12% in the No IRA case to 15% in the Reference case and about 17% in the High Uptake case. All cases show electric vehicles making up 18% to 19% of sales by 2050, in part, because EVs reach cost and performance parity against gasoline-powered models in the luxury vehicle class but remain less competitive against conventional gasoline-powered cars and light trucks serving the mass market.
Federal tax credits and incentives extended by the IRA contribute to increases in energy efficiency and reduced fossil fuel use in buildings. Electric heat pumps, including ground-source heat pumps, gain market share over the projection period, increasing from 11% of households in 2022 to about 13% of households in 2050 across all cases. The IRA extends tax credits for rooftop solar, but the total capacity from new rooftop systems only increases slightly because declining electricity prices also tend to reduce rooftop adoption rates for solar PV systems, partially offsetting the impacts of the tax credits.
Insights produced in this report should be tempered by the assumptions we made regarding IRA implementation as documented in the narrative to the AEO2023. We note in the text where simplifying assumptions may have a significant effect on our results. We excluded certain IRA provisions and programs if they lacked details regarding implementation or if we were unable to reflect the design of those provisions in our current model structure. For example, we omit the Advanced Industrial Facilities Deployment Program that funds efficient and emission-reducing equipment in the industrial sector and excluded provisions such as the tax credit to encourage the domestic of production of hydrogen.
Energy Market Issue
The IRA, which became law on August 16, 2022, contains $369 billion in clean energy investments.2 In addition to extending the clean energy production and investment tax credits (ITCs), the IRA extends tax credits for producing advanced biofuels and establishes a sustainable aviation fuel credit.
Uncertainty around IRA implementation details remains. For example, the IRA sets criteria that projects must meet to qualify for bonus ITCs and PTCs. PTCs for eligible clean energy technologies include a base tax credit that can be five times higher if a technology meets prevailing wage or apprenticeship requirements. The IRA provides additional bonus tax credits for projects that meet domestic content requirements or are located in energy communities. Energy communities are defined as former brownfield sites, areas with above-average unemployment rates, or areas that rely on fossil fuel industries for employment or tax revenue. In the IRA High and Low Uptake cases, we vary the tax credits that clean energy technologies receive to explore the range of outcomes for the U.S. energy system.
Uncertainty around IRA implementation details remains. For example, the IRA sets criteria that projects must meet to qualify for bonus ITCs and PTCs. PTCs for eligible clean energy technologies include a base tax credit that can be five times higher if a technology meets prevailing wage or apprenticeship requirements. The IRA provides additional bonus tax credits for projects that meet domestic content requirements or are located in energy communities. Energy communities are defined as former brownfield sites, areas with above-average unemployment rates, or areas that rely on fossil fuel industries for employment or tax revenue. In the IRA High and Low Uptake cases, we vary the tax credits that clean energy technologies receive to explore the range of outcomes for the U.S. energy system.
Analysis Design and Case Descriptions
This study uses the AEO2023 Reference case and three additional cases that vary IRA impacts. Table 1 summarizes each case, and the Appendix provides further details on the assumptions underlying each.
Table 1. Cases that analyze the Inflation Reduction Act (IRA) in the Annual Energy Outlook 2023
| Case | Description |
|---|---|
| Reference | This case includes energy-related provisions, as explained in the AEO2023 narrative. For eligible technologies, we assume the base tax credit and certain bonus credits. |
| No IRA | This case excludes the energy-related IRA provisions, as explained in the AEO2023 narrative. |
| IRA High Uptake | For technologies that qualify for tax credits, we assume a tax credit value that is the same or higher than the value assumed in the Reference case. Where applicable, we modeled qualified projects receiving maximum bonus credits. The number of electric vehicles assumed to qualify for the clean vehicle credit is higher than the number assumed in the Reference case. |
| IRA Low Uptake | For technologies that qualify for tax credits, we assume a tax credit value that is the same or lower than the value assumed in the Reference case. Specifically, we assume most qualified projects receive only the base tax credit, without prevailing wage, domestic content, or energy community bonuses. The number of electric vehicles assumed to qualify for the clean vehicle credit is lower than the number assumed in the Reference case. |
All cases, including the No IRA case, use macroeconomic indicators from the September 2022 economic outlook from S&P Global IHS Markit, which incorporates the IRA. As a result, all cases assume the same baseline macroeconomic activity. Any fundamental differences in macroeconomic outlooks are not explored in this analysis but are, instead, explored in the Low and High Macroeconomic cases of the AEO.
Although all provisions of the IRA are current law, we do not explicitly include certain provisions in the version of the National Energy Modeling System (NEMS) used for AEO2023 for three general reasons:
- Guidance is not yet available on how federal agencies will implement certain provisions, and absent that guidance, we lack the details to analyze the law. We will analyze these provisions in the future as we receive more clarity.
- A number of provisions require significant modifications to NEMS that were not possible in this time frame, and we will consider ways to include those provisions in a future outlook, to the extent possible.
- We excluded other provisions because they do not align with our analytic resolution. For example, NEMS does not model individual electricity transmission lines, and therefore, we do not model the IRA-driven impacts related to the planning or construction of transmission lines that are funded by assistance or loans.
The AEO2023 narrative contains additional details about which provisions we included or excluded and how we incorporated the specific energy-related provisions into NEMS. That document also explains why we excluded certain provisions based on the three reasons above.
Results and Discussion
The No IRA Case results in energy-related CO2 emissions that are 26% below the 2005 level by 2030, and the Reference case achieves a reduction of 33% by the same year. The Low and High Uptake cases bound the Reference case estimate, with IRA-specific emissions reductions ranging from about 27%–34% in 2030.
Total energy-related CO2 emissions are largely similar in the No IRA and Low Uptake cases compared with the Reference and High Uptake cases (Figure 1). In the No IRA and Low Uptake cases, energy-related CO2 emissions still decline 28% to 29% between 20053 and 2050, respectively, as renewable generation replaces carbon-intensive coal power. In the Low Uptake case, we only consider the base IRA tax credits, which results in only a minimal effect—an additional 1% emissions reduction in 2050 compared with the No IRA case. By contrast, the bonus provisions considered drive a 34% reduction in emissions in the Reference case and nearly 35% reduction in the High Uptake case from 2005 levels by 2050. These incremental emissions reductions are achieved through steeper growth of renewable generation and additional retirement of coal-fired generating capacity.
Figure 1. Energy-related CO2 emissions
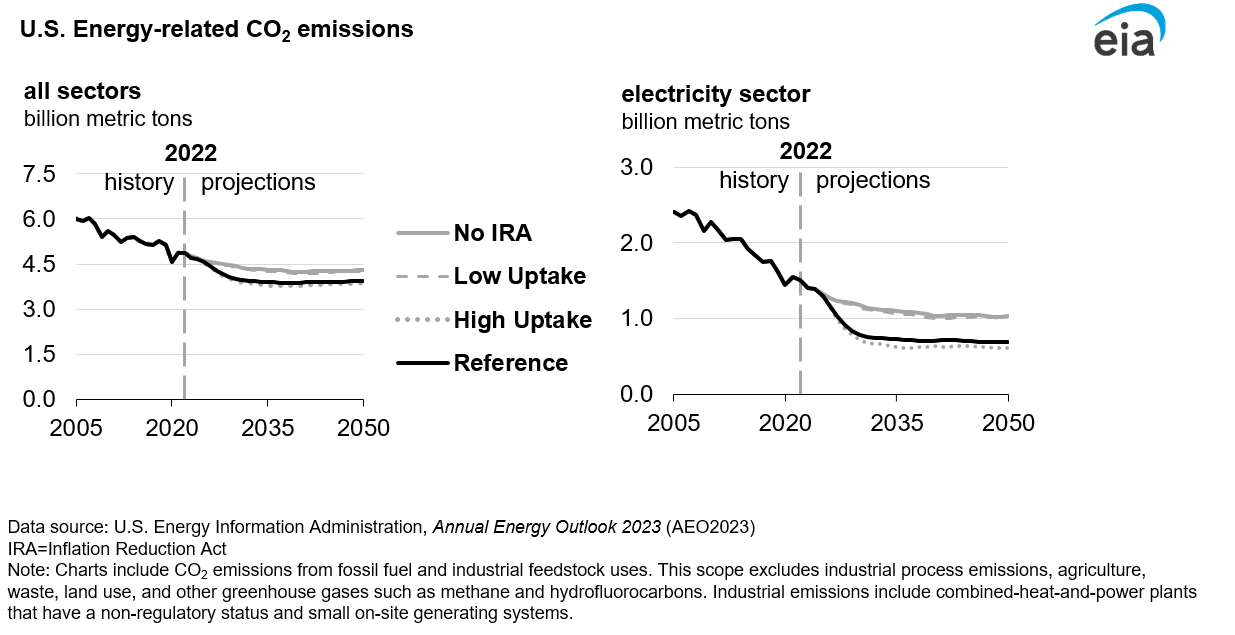
Electricity generation is the largest source of decline for CO2 emissions in all four cases. The Reference and High Uptake cases replace more coal-fired generation with renewables and, therefore, CO2 emissions decline more steeply.
In the Reference and High Uptake cases, CO2 emissions from the electric power sector decline about 72% to 75% by the end of the projection period below the 2005 levels compared with a 57% to 59% reduction in the No IRA and Low Uptake cases.
Our projections show diverging trends for the transportation and industrial sectors, which represent the two largest CO2 emitting end-use sectors. Between 2005 and 2050, transportation sector CO2 emissions decline about 18% to 19% in all cases, in part, because we assume that on-road vehicle models become more fuel-efficient and that electric and alternative-fuel vehicle use grows. Industrial sector CO2 emissions increase about 9% to 10% over the same period across all cases because of growing hydrocarbon gas liquids consumption for bulk chemical feedstocks and rising natural gas demand for manufacturing. At least 64% of the energy consumed by the industrial sector in 2050 continues to be from fossil fuels in all cases.
Solar and wind generate a majority of U.S. electricity by 2050 in the Reference and High Uptake cases
Continued low natural gas prices increase retirements of more expensive coal-fired generation assets in the near term. The IRA’s tax credits provide an incentive to add solar and wind over natural gas-fired generation, which makes them more attractive for replacing retiring coal assets and meeting incremental demand in all cases, even more so in the Reference and High Uptake cases (Figure 2).
Figure 2. U.S. net electricity generation by fuel
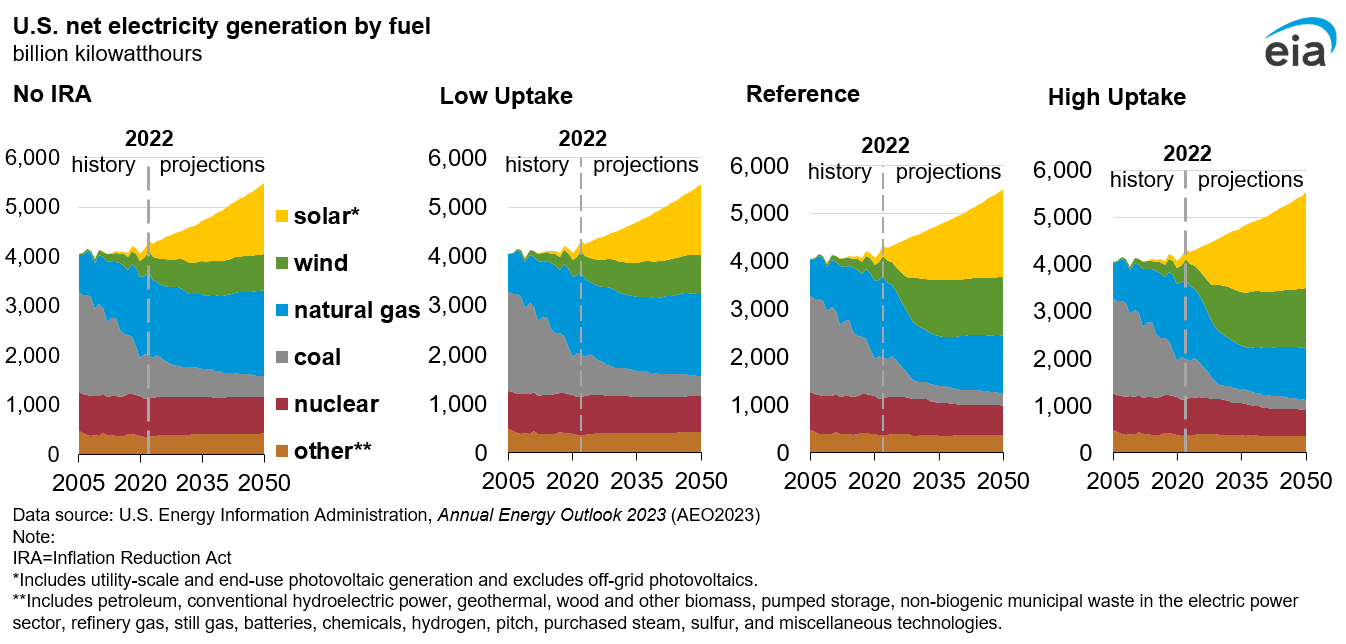
Solar and wind generation together increase from 15% of total generation in 2022 to 39% in the No IRA case by the end of the projection period. IRA provisions in the Reference case push wind and solar to 56% of electricity generation by 2050, with a range of about 41% to 59% when varying the bonus provisions in the Low and High Uptake cases. As with total energy-related CO2 emissions, the base tax credits considered in the Low Uptake case only produce a marginal effect on generation from renewables compared with the No IRA case.
Coal-fired generation decreases from 20% in 2022 to between about 4% and 8% of total generation by 2050 across all cases. In the No IRA case, the share of natural gas-fired generation decreases from 39% in 2022 to 32% in 2050. In the Reference case, the share of natural gas-fired generation decreases to 22% in 2050 and to a range of about 20% to 32% in the High and Low Uptake cases, respectively.
The available capacity for generating electricity shifts significantly in the Reference and High Uptake cases. Both cases include coal-fired generating plant retirements of about 121 gigawatts (GW) to 123 GW between 2022 and 2050, about 22 GW to 25 GW more than projected in the No IRA and Low Uptake cases. In the Reference and High Uptake cases, about 67 GW to 73 GW of coal capacity is still operating by 2050, which are mainly plants with lower costs because of higher efficiencies, lower fuel costs, or lower fixed operating costs.
Across all cases, a range of about 700 GW to 1,124 GW of new renewable capacity added over the projection period, making renewables the largest source of new capacity (Figure 3). Renewables represent about 65% of cumulative additions over the projection period in the No IRA case. In the Reference case, renewables represent 69% of cumulative additions and a range of 66% to 72% in the Low and High Uptake cases.
Figure 3. U.S. installed generating capacity by source
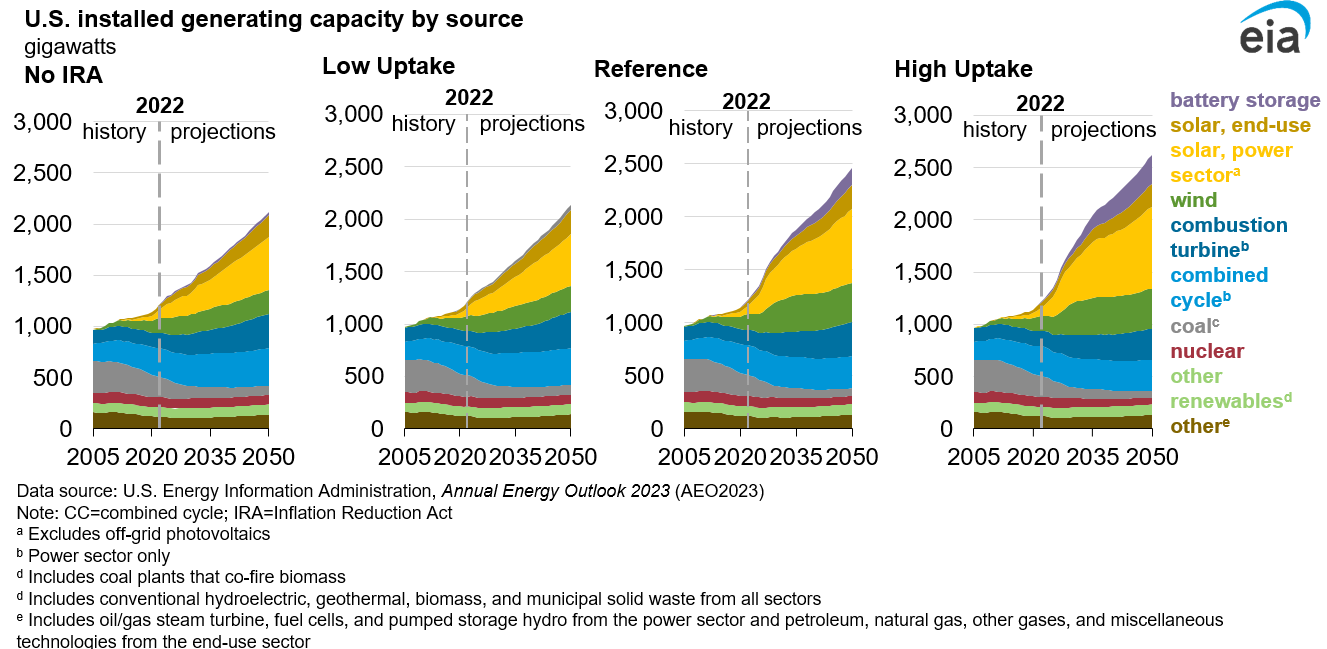
New natural gas-fired combustion turbines,4 primarily used to ensure system reliability, are also prominent, totaling about 196 GW to 203 GW of new capacity in the No IRA and Low Uptake cases. In the High Uptake case, more standalone battery storage is built (272 GW) than combustion turbine capacity (157 GW) because we assume qualifying clean energy technologies receive more bonus credits than in the Reference case. In the Reference case, new combustion turbine capacity is 179 GW, just 21 GW more than new standalone storage capacity. By contrast, in the No IRA and Low Uptake cases, four to seven times more combustion turbine capacity is built over the projection period than standalone storage. The No IRA case has 29 GW of new storage capacity, and the Low Uptake case has 46 GW.
In 2030, electricity prices in the Reference and High Uptake cases (about 10 cents per kilowatthour in 2022$) are almost 10% lower than in the No IRA and Low Uptake cases (about 11 cents per kilowatthour in both cases). Falling natural gas prices and increased government funding in the form of PTCs reduce as-bid prices in wholesale electricity markets, in turn, reducing average electricity prices across all consumers. By 2050, increases in natural gas prices and the declining pace of renewable capacity additions largely eliminates the differences in prices among the four cases.
U.S. natural gas production grows over the projection period in all cases, but production of other fossil fuels shows mixed trends
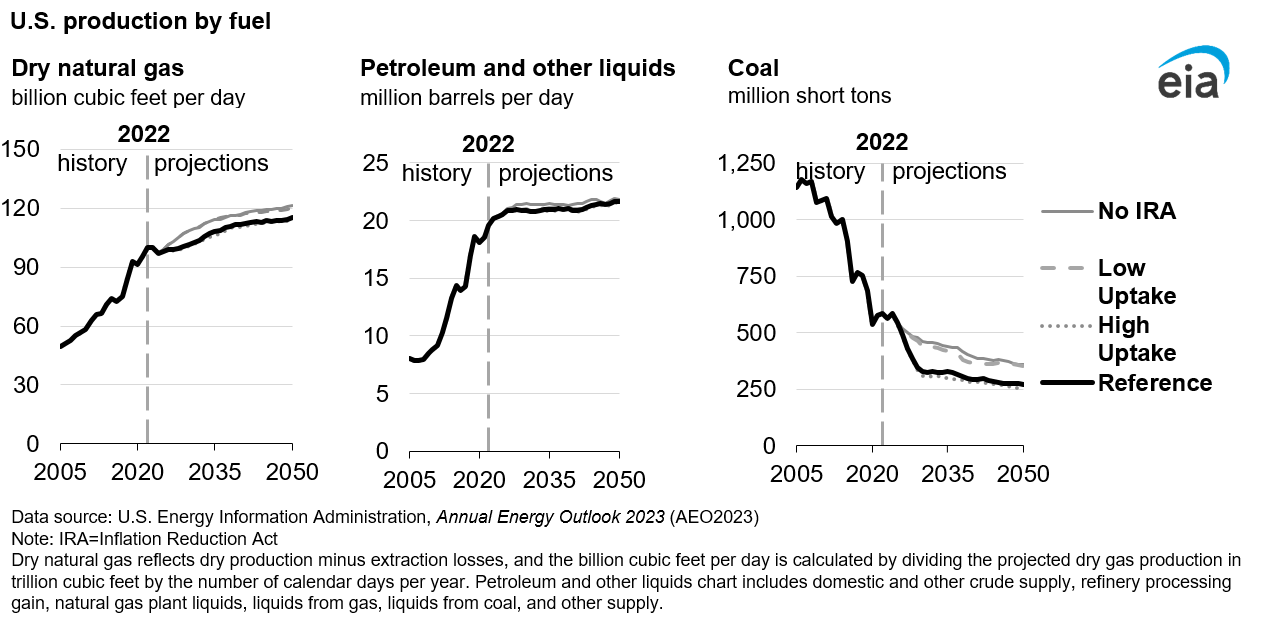
In all cases, natural gas production grows through 2050 (Figure 4). In the No IRA and Low Uptake cases, dry natural gas production by 2050 is about 120 billion cubic feet per day (Bcf/d) to 121 Bcf/d, roughly 21% more than in 2022. In the Reference and High Uptake cases, natural gas production grows about 15% over the same period to 115 Bcf/d in 2050 mainly because of export markets. Therefore, accounting for uncertainty across the IRA cases, we see natural gas production either flat to about 5% less compared with the No IRA case.
Figure 4. U.S. production by fuel
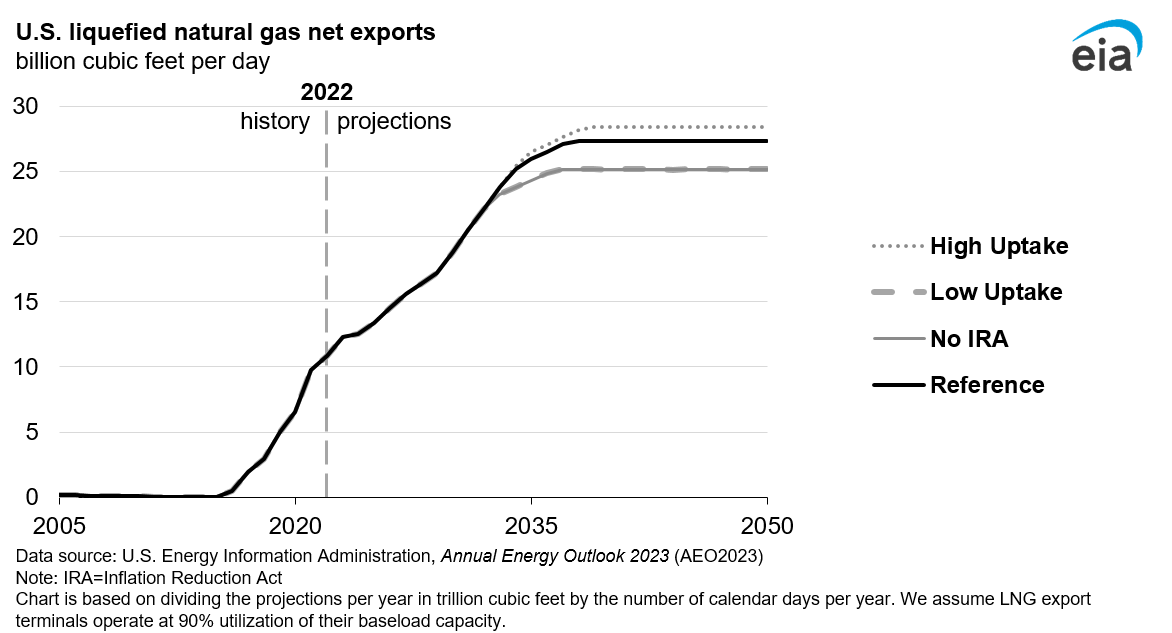
Liquefied natural gas (LNG) exports grow in all cases, but particularly in the Reference and High Uptake cases. Increased LNG exports in these two cases result from less natural gas demand for domestic power generation and relatively low domestic natural gas prices, which support wider spreads between domestic and international LNG prices. U.S. LNG exports in 2050 total between 27 Bcf/d in the Reference case and 28 Bcf/d in the High Uptake case, over 2.5 times more than in 2022. Projections in the No IRA and Low Uptake cases were about 2.3 times higher over the same period (Figure 5).
Figure 5. Liquefied natural gas net exports
Less coal-fired power generation associated with the IRA provisions also diminishes coal production, which drops about 54% in 2050 in the Reference case and roughly 57% in the High Uptake case compared with 2022, contrasted with 38% in the No IRA case and about 40% in the Low Uptake case. Coal production in 2050 is between 249 million short tons (MMst) and 360 MMst across all cases.
Because both export demand for liquid fuels and consumption of liquid fuels in the U.S. industrial sector increase, total petroleum and other liquids production remains relatively flat across the projection period in all cases from 2022 to 2050 (Figure 4). In all four cases, industrial use of petroleum and liquid fuels grows 26% to 28% over the same period, rising to about 7 million barrels per day (b/d) by the end of the projection period. By 2050, the transportation sector consumes about 12 million b/d of liquid fuels—about 9% to 10% less than in 2022—in part, because more fuel-efficient vehicle models and electric vehicles are in use.
IRA incentives lead to a rapid growth in sales of electric vehicles, more energy-efficient homes, and higher-efficiency natural gas equipment
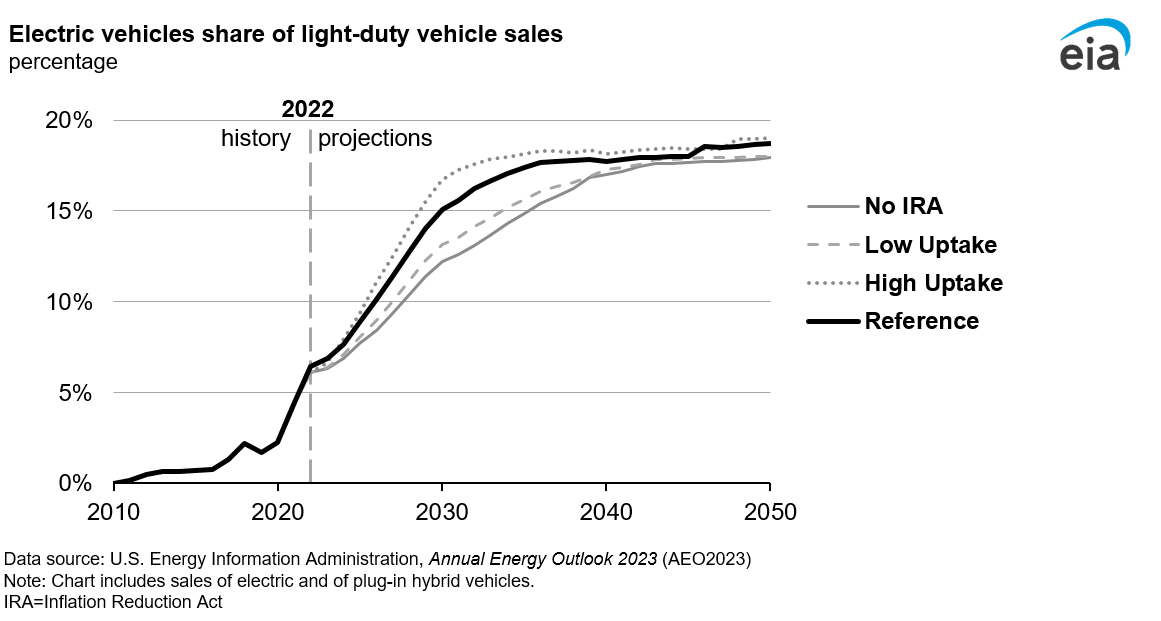
The IRA provisions stimulate rapid growth in electric vehicle sales, which include passenger cars and light trucks, but motor gasoline and diesel fuel are still in demand through 2050. Although all cases show electric vehicles making up about 18% to 19% of sales by 2050, the IRA tends to accelerate, EV deployment over the next decade (Figure 6).5 In 2030, for example, the share of EV sales jumps from 12% in the No IRA case to 15% in the Reference case and nearly 17% in the High Uptake case. Our projections show that EVs represent less than one in five light-duty vehicles sold by 2050. EVs reach cost and performance parity against gasoline-powered models in the luxury vehicle class but remain less competitive against conventional gasoline-powered cars and light trucks serving the mass market.
Some of the more stringent provisions in the IRA make qualifying for the clean vehicle tax credits more difficult, including:
- Domestic assemblage requirements
- Battery component and critical mineral sourcing requirements
- Limits on Manufacturer’s Suggested Retail Price (MSRP)
- Income limits for vehicle buyers
Figure 6. Electric vehicles share of light-duty vehicle sales
Electric heat pumps, including ground-source heat pumps, gain market share over the projection period, increasing from 11% of households in 2022 to about 13% of households in 2050 across all cases. Although the tax credits and incentives the IRA extends contribute to the growing efficient appliance adoption, such as electric air-source and ground-source heat pumps, we expect natural gas to remain the primary fuel used for space heating through 2050. By 2050 in all cases, natural gas accounts for more than 60% of the energy used to heat homes and over 80% of the energy to heat commercial buildings. Traditional heating fuels remain a significant factor because, in part, heating equipment typically lasts a long time before it needs to be replaced, and natural gas remains economically competitive as a heating fuel for buildings in all cases.6
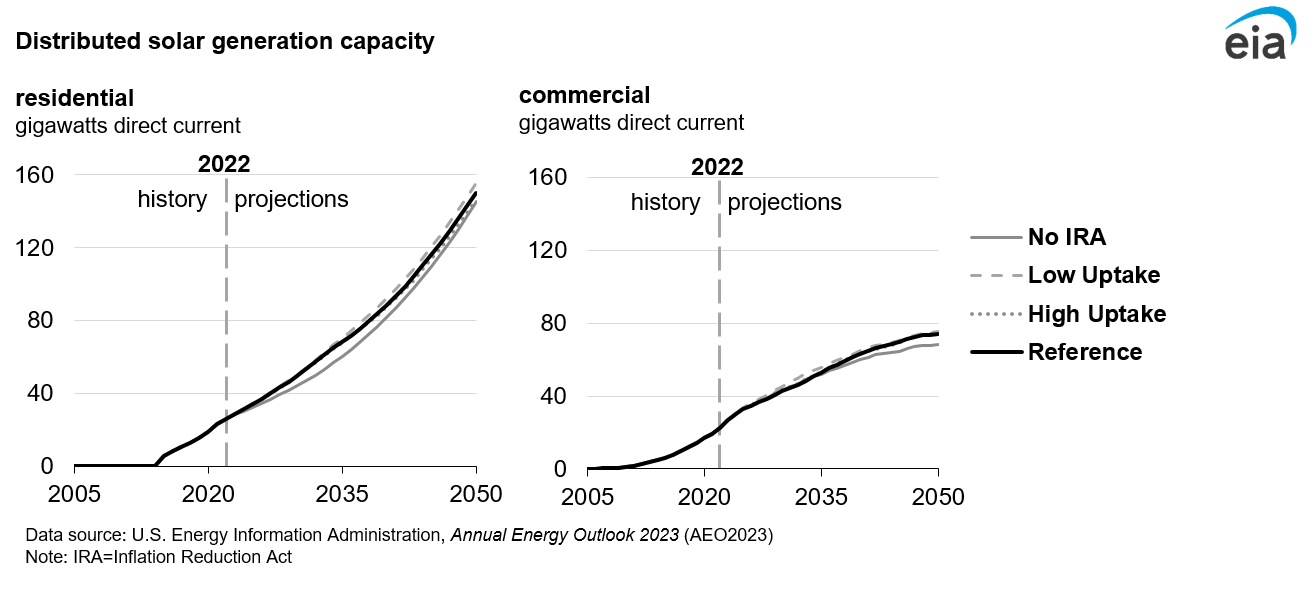
The IRA extends tax credits for rooftop solar, but capacity from new rooftop systems only increases slightly because declining electricity prices also reduce rooftop adoption rates for solar PV systems, partially offsetting the impacts of the tax credits. In 2034, the year a residential ITC expires, we expect 14% more residential solar PV capacity in the Reference case than in the No IRA case. By 2050, about 145 GW direct current (GWDC)7 of residential rooftop solar is operating in the No IRA case, which equates to about 19 million residential solar PV installations (Figure 7). The Reference case has about 19.5 million home solar systems built over the projection period compared with 19 million systems in the High Uptake case and 20 million systems in the Low Uptake case. Residential solar PV adoption increases with higher electricity prices in the Low Uptake IRA case because using power generated from onsite systems becomes more economical than purchasing electricity from the grid. PV adoption decreases in the High Uptake IRA case, where purchasing power from the grid is more economical because we project electricity prices are lower than in the Reference case.
In the commercial sector, there are not major differences in projected rooftop solar capacity among the Reference, Low Uptake, and High Uptake cases. In 2050, these cases show 74 GWDCto 75 GWDC of rooftop solar PV, which is about 6 GWDC to 7 GWDC more than projected in the No IRA case. All four cases (No IRA, Low and High Uptake, and Reference) have between 1 million and 2 million commercial rooftop solar PV systems operating by 2050.
Figure 7. Distributed solar generation capacity
Appendix
Table 2 provides the assumptions for the IRA provisions modeled in the AEO2023 Reference, Low Uptake, and High Uptake cases. As identified in the legend, the dots for each value indicate how we applied the respective tax credits. The table compares the PTC and ITC values in the Low Uptake and High Uptake cases with those assumed in the Reference case. The actual values that we model may differ from those in the table because of adjustments for inflation or phasedowns in the tax credit values.
Because the IRA allows different types of credit with bonus provisions, the impact on energy markets is uncertain. We evaluate the lower and upper bounds of tax credit impacts incorporated in the Reference case by applying the lowest tax credits allowed in the Low Uptake case and the highest tax credits allowed in the High Uptake case. Given the high uncertainty in terms of which projects qualify for the energy communities credit, we only applied this tax credit in the High Uptake case. The applicable IRA provisions for the eligible technologies in the AEO2023 Reference case are explained in the respective NEMS Module Assumptions documents.
| Number of tax credits applied | Type of tax credit |
|---|---|
| • | base |
| •• | base + prevailing wage and apprenticeship, unless specified |
| ••• | base + prevailing wage and apprenticeship + domestic content, unless specified |
| •••• | base + prevailing wage and apprenticeship + domestic content + energy communities |
| Technology type | Low Uptake | Reference | High Uptake |
|---|---|---|---|
| Electric power sector Production tax credita (Values shown in 1992 dollars) |
|||
| Advanced nuclear and small modular reactor (modeled with the PTC in Low Uptake and Reference cases and the ITC in the High Uptake case) | 0.3 cents/kWh • |
1.65 cents/kWh ••• |
50%b •••• |
Biomass | 0.3 cents/kWh • |
1.5 cents/kWh •• |
1.82 cents/kWh •••• |
| Onshore wind | 0.3 cents/kWh • |
1.65 cents/kWh ••• |
1.82 cents/kWh •••• |
| Solar photovoltaic (PV) with single-axis tracking | 0.3 cents/kWh • |
1.5 cents/kWh •• |
1.82 cents/kWh •••• |
| Solar PV-battery storage hybridc | 0.3 cents/kWh • |
1.5 cents/kWh •• |
1.82 cents/kWh •••• |
| Investment tax credit | |||
| Geothermal | 6% • |
30% •• |
50% •••• |
| Conventional hydropower | 6% • |
30% •• |
50% •••• |
| Offshore wind | 6% • |
40%d ••• |
50%d •••• |
| Solar thermal | 6% • |
30% •• |
50% •••• |
| Battery storage | 6% • |
30% •• |
50% •••• |
| End-use sector | |||
| Investment tax credit | |||
| Residential | |||
| Residential solar PV, solar water heating, fuel cell, wind, geothermal heat pump (tax credit modeled as 30% in 2022–32, 26% in 2033, 22% in 2034, and 0% in 2035–50) | 30% • |
30% • |
30% • |
| Residential heating, cooling, and water heating (tax credit modeled 2022–32) | 30% • |
30% • |
30% • |
| Qualified efficient new construction (tax credit modeled 2022–32) | $500–$2,500 •• |
$500–$2,500 •• |
$500–$2,500 •• |
| Commercial | |||
| Solar PV (tax credit values modeled 2022–50) | 30% • |
30% • |
40% ••• |
| Wind (tax credit values modeled 2022–50) | 6% • |
30% •• |
40% ••• |
| Geothermal heat pumps (tax credit modeled as 30% in 2022–32, 26% in 2033, 22% in 2034, and 0% in 2035–50) | 30% • |
30% • |
40%e •• |
| Natural gas fuel cell (less than 1 MW; tax credit modeled through 2024) | 30% • |
30% • |
40%e •• |
| Microturbine (less than 1 MW; tax credit modeled through 2024) | 10% • |
10% • |
20%e •• |
| Natural gas engine for CHP (tax credit modeled through 2024) | 10% • |
10% • |
20%e •• |
| Natural gas turbine (greater than 1 MW; tax credit modeled through 2024) | 10% • |
10% • |
40% ••• |
| Industrial | |||
| Industrial CHP (tax credit modeled through 2024)e | 10% • |
10% • |
42% ••• |
| Carbon capture and sequestration (Values are in nominal dollars through 2026 and real (2026) dollars for subsequent years) | |||
| CCS | $17/mt • |
$85/mt •• |
$85/mt •• |
| CCUS and EOR | $12/mt • |
$60/mt •• |
$60/mt •• |
| Zero-emission nuclear power production creditf | |||
| Existing nuclear facility | 0.3 cents/kWh • |
1.5 cents/kWh •• |
1.5 cents/kWh •• |
| Clean vehicle credit | Number of qualifying electric vehicles assumedg | ~1 million | ~2 million | ~4 million |
| Clean fuel production credit (Values in nominal dollars and tax credits modeled through 2027) | |||
| Sustainable aviation fuelh | $1.25/gal •• |
$1.25/gal •• |
$1.25/gal •• |
| Biodiesel and renewable diesel | $1.00/gal •• |
$1.00/gal •• |
$1.00/gal •• |
|
Data source: U.S. Energy Information Administration, Annual Energy Outlook 2023
(AEO2023) Note: MW=megawatt kWh=kilowatthour mt=metric ton gal=gallon CHP=combined heat and power CCS=carbon capture sequestration CCUS=carbon capture, utilization, storage EOR=enhanced oil recovery IRA=Inflation Reduction Act a Values are shown in 1992 dollars to reflect the language of the IRA, which has its foundations in the Energy Policy Act of 1992. Per the law, values are adjusted annually to reflect historical and projected inflation from the 1992 starting point. b Advanced nuclear and small modular reactors can choose between either the PTC or the ITC. We assume these technologies will opt for the more valuable PTC, except in the High Uptake case, where the ITC is more valuable. c Without additional guidance at the time of AEO2023 publication, we assume solar PV-battery hybrid systems will choose the PTC. d We assume domestic content requirements are satisfied, starting with 2032 online year. e In the High Uptake case, we assume commercial systems smaller than 1 MW receive a 10% domestic content bonus credit on top of the base credit. In the Low Uptake and Reference cases, we assume industrial CHP projects receive the 6% base credit plus the 2% adder for not satisfying the domestic content requirement and a separate 2% adder for not satisfying the energy communities bonus credit per Section 13102 of the IRA. For the High Uptake case, we assume industrial CHP projects receive the base credit and the maximum tax credit available for the prevailing wage and apprenticeship and domestic content requirements. However, we keep the 2% minimum adder in the High Uptake case for not satisfying the energy communities credit. f This value is in 2022 dollars, adjusted annually for inflation through expiration in 2032. Reference and High Uptake cases include prevailing wage requirements. g For our vehicle sales projections, we did not project the number of vehicles that will qualify based on explicitly modeling each of the clean vehicle tax credit qualification requirements. Rather, we assume a total number of vehicles that qualify for the clean vehicle tax credit based on an analysis of IRA expenditure estimates from the U.S. Congressional Budget Office’s August 5, 2022, “Summary Estimated Budgetary Effects of H.R. 5376, the Inflation Reduction Act of 2022.” h We modeled $1.25/gal in 2024 and $1.75/gal in 2025–27. |
|||
Footnotes
- For our vehicle sales projections, we did not project the number of vehicles that will qualify based on explicitly modeling each of the clean vehicle tax credit qualification requirements. Rather, we assume a total number of vehicles that qualify for the clean vehicle tax credit based on an analysis of IRA expenditure estimates from the U.S. Congressional Budget Office’s August 5, 2022, summary called “ Summary Estimated Budgetary Effects of H.R. 5376, the Inflation Reduction Act of 2022.”
- U.S. Department of the Treasury, “Treasury Seeks Public Input on Additional Clean Energy Tax Provisions of the Inflation Reduction Act,” November 3, 2022, https://home.treasury.gov/news/press-releases/jy1077.
- 2005 is the emissions baseline year referenced in the Paris Agreement adopted in 2015, and it is used to measure a signatory nation’s progress toward meeting a Nationally Determined Contribution that aims to achieve carbon emission reduction goals. The baseline year is also included within the United States’ Nationally Determined Contribution as of April 2021. Although 2030 represents the target year for the NDC, we cite projections for 2050 to capture the full effect of the IRA.
- Combustion turbines are modeled as dual-fuel units capable of burning both natural gas and diesel fuel oil. In practice, dual-fuel turbines primarily use natural gas, with diesel capabilities available in rare cases where natural gas supplies may be constrained. Model results reflect the use of natural gas in dual-fuel combustion turbines.
- For our vehicle sales projections, we did not project the number of vehicles that will qualify based on explicitly modeling each of the clean vehicle tax credit qualification requirements. Rather, we assume a total number of vehicles that qualify for the clean vehicle tax credit based on an analysis of IRA expenditure estimates from the U.S. Congressional Budget Office’s August 5, 2022, summary called “Summary Estimated Budgetary Effects of H.R. 5376, the Inflation Reduction Act of 2022.”
- In AEO2023, we were also unable to model certain rebate programs for home upgrades such as the High-Efficiency Electric Home Rebate Program and Home Owner Managing Energy Savings (HOMES) until further guidance is available on how states and tribes plan to implement these programs. Inclusion of these provisions may lead to further adoption of efficient electric technologies; however, the pace of electrification depends on changing out equipment with lifetimes that can last 20–30 years.
- Solar photovoltaic (PV) capacity in the residential and commercial sectors are typically expressed in terms of the direct-current (DC) rated capacity of the PV panel, as opposed to the alternating current (AC) rating of the associated inverter used to measure utility-scale generators, including utility-scale PV facilities elsewhere in this report. Unless otherwise noted, as for residential and commercial PV, electric-generating capacity is reported in AC terms.