|
Download Data (XLS File) |
|
|||||
|
|||||
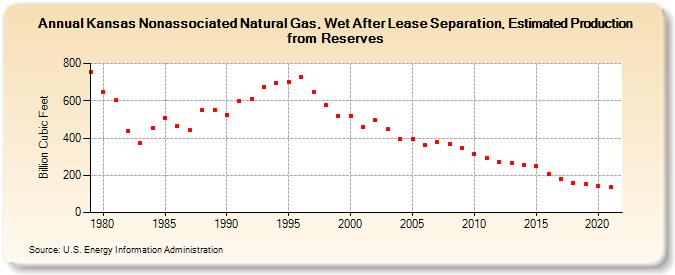
| Kansas Nonassociated Natural Gas, Wet After Lease Separation, Estimated Production from Reserves (Billion Cubic Feet) | |||||
| Decade | Year-0 | Year-1 | Year-2 | Year-3 | Year-4 | Year-5 | Year-6 | Year-7 | Year-8 | Year-9 |
|---|---|---|---|---|---|---|---|---|---|---|
| 1970's | 755 | |||||||||
| 1980's | 647 | 602 | 439 | 374 | 455 | 509 | 465 | 441 | 551 | 553 |
| 1990's | 525 | 597 | 610 | 675 | 697 | 702 | 730 | 647 | 577 | 520 |
| 2000's | 519 | 460 | 495 | 446 | 396 | 396 | 365 | 377 | 368 | 346 |
| 2010's | 316 | 294 | 273 | 266 | 253 | 248 | 205 | 180 | 159 | 151 |
| 2020's | 145 | 136 |
| - = No Data Reported; -- = Not Applicable; NA = Not Available; W = Withheld to avoid disclosure of individual company data. |
| Release Date: 12/30/2022 |
| Next Release Date: NA |