|
Download Data (XLS File) |
|
|||||
|
|||||
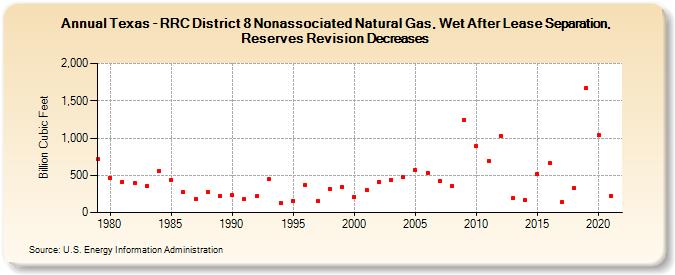
| Texas - RRC District 8 Nonassociated Natural Gas, Wet After Lease Separation, Reserves Revision Decreases (Billion Cubic Feet) | |||||
| Decade | Year-0 | Year-1 | Year-2 | Year-3 | Year-4 | Year-5 | Year-6 | Year-7 | Year-8 | Year-9 |
|---|---|---|---|---|---|---|---|---|---|---|
| 1970's | 714 | |||||||||
| 1980's | 467 | 416 | 396 | 356 | 559 | 441 | 276 | 179 | 277 | 220 |
| 1990's | 235 | 177 | 216 | 446 | 128 | 160 | 368 | 155 | 317 | 344 |
| 2000's | 206 | 303 | 412 | 443 | 472 | 568 | 537 | 423 | 362 | 1,242 |
| 2010's | 894 | 698 | 1,031 | 193 | 162 | 520 | 667 | 143 | 328 | 1,674 |
| 2020's | 1,035 | 223 |
| - = No Data Reported; -- = Not Applicable; NA = Not Available; W = Withheld to avoid disclosure of individual company data. |
| Release Date: 12/30/2022 |
| Next Release Date: NA |