|
Download Data (XLS File) |
|
|||||
|
|||||
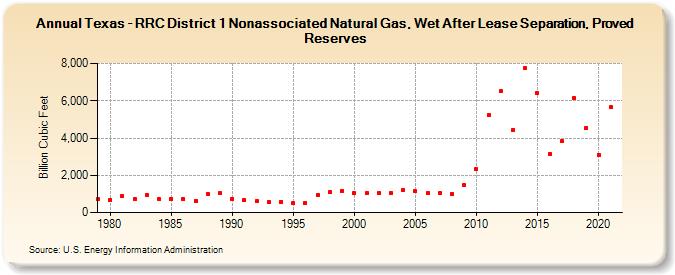
| Texas - RRC District 1 Nonassociated Natural Gas, Wet After Lease Separation, Proved Reserves (Billion Cubic Feet) | |||||
| Decade | Year-0 | Year-1 | Year-2 | Year-3 | Year-4 | Year-5 | Year-6 | Year-7 | Year-8 | Year-9 |
|---|---|---|---|---|---|---|---|---|---|---|
| 1970's | 732 | |||||||||
| 1980's | 683 | 870 | 708 | 960 | 714 | 754 | 716 | 639 | 1,002 | 1,037 |
| 1990's | 744 | 660 | 606 | 540 | 586 | 498 | 523 | 950 | 1,101 | 1,165 |
| 2000's | 1,037 | 1,024 | 1,047 | 1,047 | 1,184 | 1,148 | 1,048 | 1,029 | 987 | 1,456 |
| 2010's | 2,332 | 5,227 | 6,516 | 4,442 | 7,733 | 6,400 | 3,159 | 3,835 | 6,141 | 4,563 |
| 2020's | 3,090 | 5,663 |
| - = No Data Reported; -- = Not Applicable; NA = Not Available; W = Withheld to avoid disclosure of individual company data. |
| Release Date: 12/30/2022 |
| Next Release Date: NA |