|
Download Data (XLS File) |
|
|||||
|
|||||
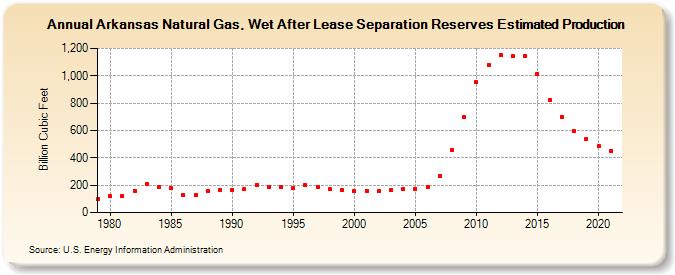
| Arkansas Natural Gas, Wet After Lease Separation Reserves Estimated Production (Billion Cubic Feet) | |||||
| Decade | Year-0 | Year-1 | Year-2 | Year-3 | Year-4 | Year-5 | Year-6 | Year-7 | Year-8 | Year-9 |
|---|---|---|---|---|---|---|---|---|---|---|
| 1970's | 102 | |||||||||
| 1980's | 118 | 122 | 159 | 207 | 189 | 177 | 126 | 130 | 160 | 167 |
| 1990's | 165 | 173 | 205 | 188 | 186 | 182 | 201 | 190 | 170 | 164 |
| 2000's | 154 | 161 | 158 | 166 | 170 | 174 | 188 | 269 | 457 | 698 |
| 2010's | 952 | 1,080 | 1,152 | 1,141 | 1,143 | 1,015 | 823 | 697 | 595 | 535 |
| 2020's | 485 | 450 |
| - = No Data Reported; -- = Not Applicable; NA = Not Available; W = Withheld to avoid disclosure of individual company data. |
| Release Date: 12/30/2022 |
| Next Release Date: NA |