|
Download Data (XLS File) |
|
|||||
|
|||||
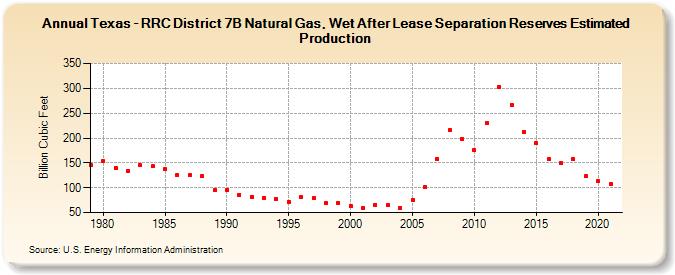
| Texas - RRC District 7B Natural Gas, Wet After Lease Separation Reserves Estimated Production (Billion Cubic Feet) | |||||
| Decade | Year-0 | Year-1 | Year-2 | Year-3 | Year-4 | Year-5 | Year-6 | Year-7 | Year-8 | Year-9 |
|---|---|---|---|---|---|---|---|---|---|---|
| 1970's | 146 | |||||||||
| 1980's | 153 | 140 | 134 | 145 | 143 | 137 | 125 | 125 | 124 | 95 |
| 1990's | 96 | 86 | 82 | 80 | 77 | 72 | 81 | 79 | 69 | 70 |
| 2000's | 63 | 59 | 66 | 65 | 60 | 76 | 101 | 158 | 216 | 199 |
| 2010's | 175 | 231 | 303 | 267 | 213 | 189 | 157 | 149 | 157 | 123 |
| 2020's | 113 | 107 |
| - = No Data Reported; -- = Not Applicable; NA = Not Available; W = Withheld to avoid disclosure of individual company data. |
| Release Date: 12/30/2022 |
| Next Release Date: NA |