|
Download Data (XLS File) |
|
|||||
|
|||||
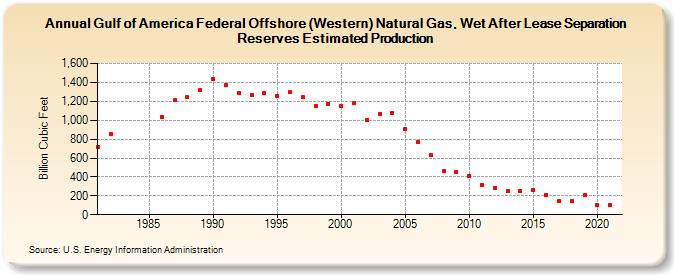
| Gulf of America Federal Offshore (Western) Natural Gas, Wet After Lease Separation Reserves Estimated Production (Billion Cubic Feet) | |||||
| Decade | Year-0 | Year-1 | Year-2 | Year-3 | Year-4 | Year-5 | Year-6 | Year-7 | Year-8 | Year-9 |
|---|---|---|---|---|---|---|---|---|---|---|
| 1980's | 721 | 857 | 1,032 | 1,210 | 1,241 | 1,318 | ||||
| 1990's | 1,440 | 1,368 | 1,284 | 1,268 | 1,292 | 1,258 | 1,293 | 1,246 | 1,150 | 1,171 |
| 2000's | 1,154 | 1,184 | 1,004 | 1,067 | 1,077 | 912 | 768 | 627 | 464 | 454 |
| 2010's | 409 | 318 | 286 | 246 | 254 | 260 | 211 | 147 | 144 | 208 |
| 2020's | 102 | 103 |
| - = No Data Reported; -- = Not Applicable; NA = Not Available; W = Withheld to avoid disclosure of individual company data. |
| Release Date: 12/30/2022 |
| Next Release Date: NA |