|
Download Data (XLS File) |
|
|||||
|
|||||
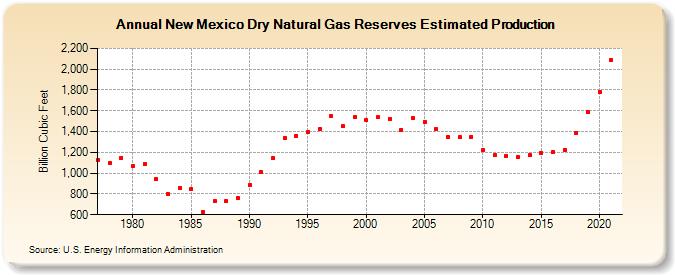
| New Mexico Dry Natural Gas Reserves Estimated Production (Billion Cubic Feet) | |||||
| Decade | Year-0 | Year-1 | Year-2 | Year-3 | Year-4 | Year-5 | Year-6 | Year-7 | Year-8 | Year-9 |
|---|---|---|---|---|---|---|---|---|---|---|
| 1970's | 1,127 | 1,099 | 1,149 | |||||||
| 1980's | 1,064 | 1,086 | 942 | 799 | 856 | 843 | 628 | 728 | 731 | 760 |
| 1990's | 887 | 1,013 | 1,143 | 1,337 | 1,362 | 1,397 | 1,423 | 1,547 | 1,449 | 1,539 |
| 2000's | 1,508 | 1,536 | 1,524 | 1,415 | 1,527 | 1,493 | 1,426 | 1,349 | 1,349 | 1,350 |
| 2010's | 1,220 | 1,170 | 1,169 | 1,155 | 1,174 | 1,197 | 1,202 | 1,223 | 1,387 | 1,589 |
| 2020's | 1,785 | 2,088 |
| - = No Data Reported; -- = Not Applicable; NA = Not Available; W = Withheld to avoid disclosure of individual company data. |
| Release Date: 12/30/2022 |
| Next Release Date: NA |