|
Download Data (XLS File) |
|
|||||
|
|||||
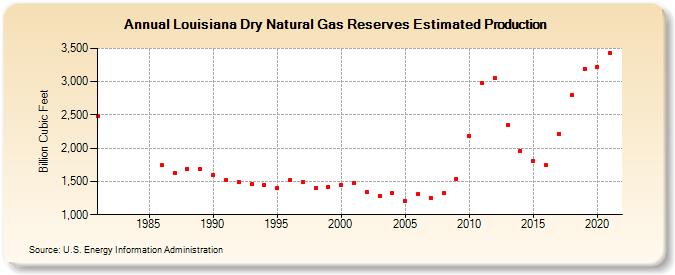
| Louisiana Dry Natural Gas Reserves Estimated Production (Billion Cubic Feet) | |||||
| Decade | Year-0 | Year-1 | Year-2 | Year-3 | Year-4 | Year-5 | Year-6 | Year-7 | Year-8 | Year-9 |
|---|---|---|---|---|---|---|---|---|---|---|
| 1980's | 2,482 | 1,741 | 1,625 | 1,691 | 1,687 | |||||
| 1990's | 1,596 | 1,527 | 1,494 | 1,457 | 1,453 | 1,403 | 1,521 | 1,496 | 1,403 | 1,421 |
| 2000's | 1,443 | 1,479 | 1,338 | 1,280 | 1,322 | 1,206 | 1,309 | 1,257 | 1,319 | 1,544 |
| 2010's | 2,189 | 2,985 | 3,057 | 2,344 | 1,960 | 1,807 | 1,740 | 2,217 | 2,792 | 3,191 |
| 2020's | 3,223 | 3,431 |
| - = No Data Reported; -- = Not Applicable; NA = Not Available; W = Withheld to avoid disclosure of individual company data. |
| Release Date: 12/30/2022 |
| Next Release Date: NA |