|
Download Data (XLS File) |
|
|||||
|
|||||
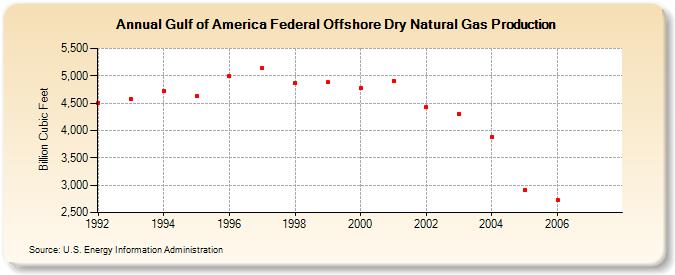
| Gulf of America Federal Offshore Dry Natural Gas Production (Billion Cubic Feet) | |||||
| Decade | Year-0 | Year-1 | Year-2 | Year-3 | Year-4 | Year-5 | Year-6 | Year-7 | Year-8 | Year-9 |
|---|---|---|---|---|---|---|---|---|---|---|
| 1990's | 4,508 | 4,577 | 4,725 | 4,627 | 4,991 | 5,133 | 4,872 | 4,885 | ||
| 2000's | 4,773 | 4,913 | 4,423 | 4,306 | 3,874 | 2,906 | 2,738 | NA |
| - = No Data Reported; -- = Not Applicable; NA = Not Available; W = Withheld to avoid disclosure of individual company data. |
| Release Date: 12/30/2022 |
| Next Release Date: NA |