|
Download Data (XLS File) |
|
|||||
|
|||||
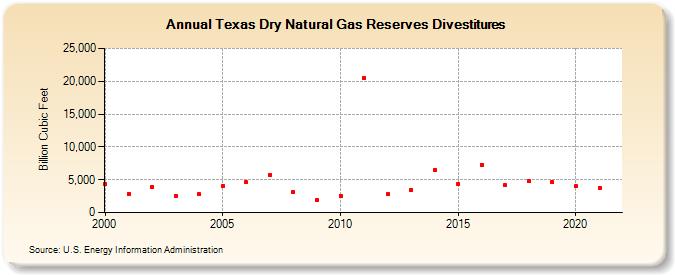
| Texas Dry Natural Gas Reserves Divestitures (Billion Cubic Feet) | |||||
| Decade | Year-0 | Year-1 | Year-2 | Year-3 | Year-4 | Year-5 | Year-6 | Year-7 | Year-8 | Year-9 |
|---|---|---|---|---|---|---|---|---|---|---|
| 2000's | 4,402 | 2,902 | 3,889 | 2,552 | 2,780 | 4,098 | 4,603 | 5,790 | 3,087 | 1,852 |
| 2010's | 2,580 | 20,510 | 2,774 | 3,423 | 6,483 | 4,353 | 7,308 | 4,145 | 4,778 | 4,591 |
| 2020's | 3,978 | 3,796 |
| - = No Data Reported; -- = Not Applicable; NA = Not Available; W = Withheld to avoid disclosure of individual company data. |
| Release Date: 12/30/2022 |
| Next Release Date: NA |