|
Download Data (XLS File) |
|
|||||
|
|||||
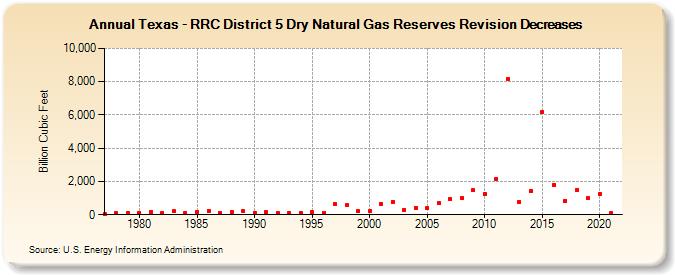
| Texas - RRC District 5 Dry Natural Gas Reserves Revision Decreases (Billion Cubic Feet) | |||||
| Decade | Year-0 | Year-1 | Year-2 | Year-3 | Year-4 | Year-5 | Year-6 | Year-7 | Year-8 | Year-9 |
|---|---|---|---|---|---|---|---|---|---|---|
| 1970's | 34 | 85 | 108 | |||||||
| 1980's | 113 | 192 | 114 | 200 | 116 | 177 | 247 | 112 | 172 | 213 |
| 1990's | 115 | 151 | 105 | 99 | 116 | 170 | 132 | 636 | 557 | 203 |
| 2000's | 222 | 650 | 785 | 278 | 421 | 398 | 683 | 952 | 1,013 | 1,458 |
| 2010's | 1,274 | 2,157 | 8,168 | 769 | 1,417 | 6,177 | 1,812 | 853 | 1,496 | 976 |
| 2020's | 1,257 | 124 |
| - = No Data Reported; -- = Not Applicable; NA = Not Available; W = Withheld to avoid disclosure of individual company data. |
| Release Date: 12/30/2022 |
| Next Release Date: NA |