|
Download Data (XLS File) |
|
|||||
|
|||||
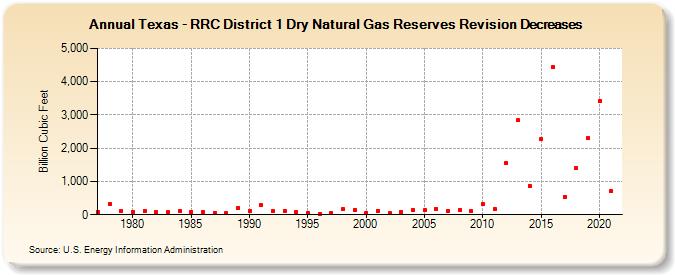
| Texas - RRC District 1 Dry Natural Gas Reserves Revision Decreases (Billion Cubic Feet) | |||||
| Decade | Year-0 | Year-1 | Year-2 | Year-3 | Year-4 | Year-5 | Year-6 | Year-7 | Year-8 | Year-9 |
|---|---|---|---|---|---|---|---|---|---|---|
| 1970's | 95 | 330 | 123 | |||||||
| 1980's | 95 | 118 | 73 | 69 | 119 | 91 | 85 | 62 | 47 | 213 |
| 1990's | 119 | 285 | 102 | 126 | 87 | 45 | 36 | 55 | 168 | 137 |
| 2000's | 62 | 120 | 47 | 87 | 128 | 130 | 182 | 110 | 145 | 104 |
| 2010's | 320 | 174 | 1,548 | 2,833 | 872 | 2,265 | 4,429 | 541 | 1,391 | 2,292 |
| 2020's | 3,420 | 705 |
| - = No Data Reported; -- = Not Applicable; NA = Not Available; W = Withheld to avoid disclosure of individual company data. |
| Release Date: 12/30/2022 |
| Next Release Date: NA |