|
Download Data (XLS File) |
|
|||||
|
|||||
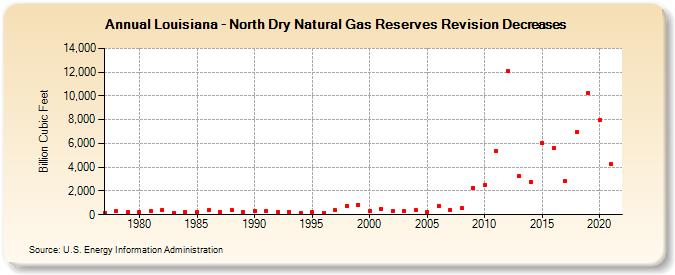
| Louisiana - North Dry Natural Gas Reserves Revision Decreases (Billion Cubic Feet) | |||||
| Decade | Year-0 | Year-1 | Year-2 | Year-3 | Year-4 | Year-5 | Year-6 | Year-7 | Year-8 | Year-9 |
|---|---|---|---|---|---|---|---|---|---|---|
| 1970's | 183 | 282 | 226 | |||||||
| 1980's | 248 | 284 | 438 | 179 | 209 | 203 | 395 | 259 | 434 | 236 |
| 1990's | 306 | 303 | 234 | 264 | 166 | 210 | 173 | 378 | 725 | 842 |
| 2000's | 298 | 522 | 293 | 319 | 417 | 252 | 759 | 424 | 556 | 2,288 |
| 2010's | 2,485 | 5,321 | 12,077 | 3,238 | 2,770 | 6,036 | 5,602 | 2,796 | 6,952 | 10,250 |
| 2020's | 8,004 | 4,258 |
| - = No Data Reported; -- = Not Applicable; NA = Not Available; W = Withheld to avoid disclosure of individual company data. |
| Release Date: 12/30/2022 |
| Next Release Date: NA |