|
Download Data (XLS File) |
|
|||||
|
|||||
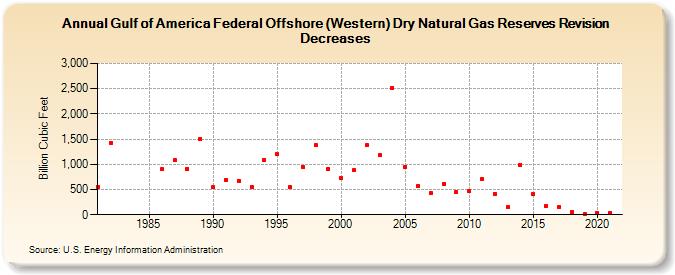
| Gulf of America Federal Offshore (Western) Dry Natural Gas Reserves Revision Decreases (Billion Cubic Feet) | |||||
| Decade | Year-0 | Year-1 | Year-2 | Year-3 | Year-4 | Year-5 | Year-6 | Year-7 | Year-8 | Year-9 |
|---|---|---|---|---|---|---|---|---|---|---|
| 1980's | 555 | 1,431 | 898 | 1,079 | 913 | 1,503 | ||||
| 1990's | 548 | 695 | 670 | 552 | 1,081 | 1,200 | 549 | 951 | 1,380 | 902 |
| 2000's | 733 | 878 | 1,378 | 1,182 | 2,516 | 956 | 575 | 425 | 618 | 447 |
| 2010's | 461 | 712 | 419 | 156 | 990 | 412 | 174 | 161 | 58 | 19 |
| 2020's | 40 | 43 |
| - = No Data Reported; -- = Not Applicable; NA = Not Available; W = Withheld to avoid disclosure of individual company data. |
| Release Date: 12/30/2022 |
| Next Release Date: NA |