|
Download Data (XLS File) |
|
|||||
|
|||||
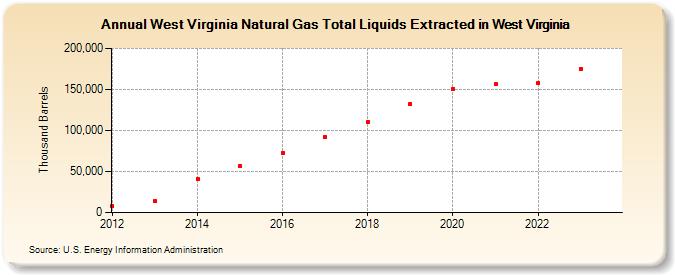
| West Virginia Natural Gas Total Liquids Extracted in West Virginia (Thousand Barrels) | |||||
| Decade | Year-0 | Year-1 | Year-2 | Year-3 | Year-4 | Year-5 | Year-6 | Year-7 | Year-8 | Year-9 |
|---|---|---|---|---|---|---|---|---|---|---|
| 2010's | 8,010 | 14,195 | 41,116 | 56,642 | 72,874 | 91,902 | 110,666 | 132,355 | ||
| 2020's | 150,583 | 156,145 | 157,663 | 175,458 | 210,984 |
| - = No Data Reported; -- = Not Applicable; NA = Not Available; W = Withheld to avoid disclosure of individual company data. |
| Release Date: 6/30/2026 |
| Next Release Date: 7/31/2026 |