|
Download Data (XLS File) |
|
|||||
|
|||||
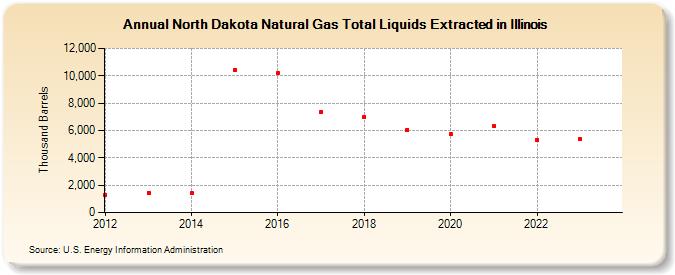
| North Dakota Natural Gas Total Liquids Extracted in Illinois (Thousand Barrels) | |||||
| Decade | Year-0 | Year-1 | Year-2 | Year-3 | Year-4 | Year-5 | Year-6 | Year-7 | Year-8 | Year-9 |
|---|---|---|---|---|---|---|---|---|---|---|
| 2010's | 1,291 | 1,454 | 1,404 | 10,431 | 10,195 | 7,372 | 6,990 | 6,067 | ||
| 2020's | 5,756 | 6,357 | 5,330 | 5,377 | 5,931 |
| - = No Data Reported; -- = Not Applicable; NA = Not Available; W = Withheld to avoid disclosure of individual company data. |
| Release Date: 6/30/2026 |
| Next Release Date: 7/31/2026 |