|
Download Data (XLS File) |
|
|||||
|
|||||
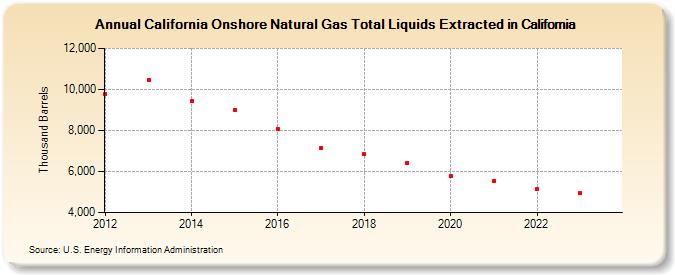
| California Onshore Natural Gas Total Liquids Extracted in California (Thousand Barrels) | |||||
| Decade | Year-0 | Year-1 | Year-2 | Year-3 | Year-4 | Year-5 | Year-6 | Year-7 | Year-8 | Year-9 |
|---|---|---|---|---|---|---|---|---|---|---|
| 2010's | 9,790 | 10,476 | 9,427 | 8,993 | 8,077 | 7,122 | 6,846 | 6,433 | ||
| 2020's | 5,787 | 5,528 | 5,138 | 4,965 | 4,495 |
| - = No Data Reported; -- = Not Applicable; NA = Not Available; W = Withheld to avoid disclosure of individual company data. |
| Release Date: 6/30/2026 |
| Next Release Date: 7/31/2026 |