|
Download Data (XLS File) |
|
|||||
|
|||||
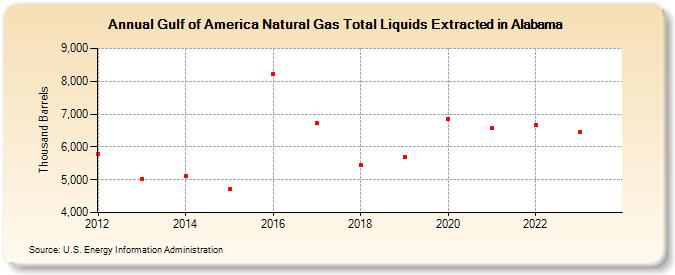
| Gulf of America Natural Gas Total Liquids Extracted in Alabama (Thousand Barrels) | |||||
| Decade | Year-0 | Year-1 | Year-2 | Year-3 | Year-4 | Year-5 | Year-6 | Year-7 | Year-8 | Year-9 |
|---|---|---|---|---|---|---|---|---|---|---|
| 2010's | 5,783 | 5,035 | 5,105 | 4,714 | 8,233 | 6,723 | 5,445 | 5,684 | ||
| 2020's | 6,838 | 6,563 | 6,676 | 6,455 | 5,884 |
| - = No Data Reported; -- = Not Applicable; NA = Not Available; W = Withheld to avoid disclosure of individual company data. |
| Release Date: 6/30/2026 |
| Next Release Date: 7/31/2026 |