|
Download Data (XLS File) |
|
|||||
|
|||||
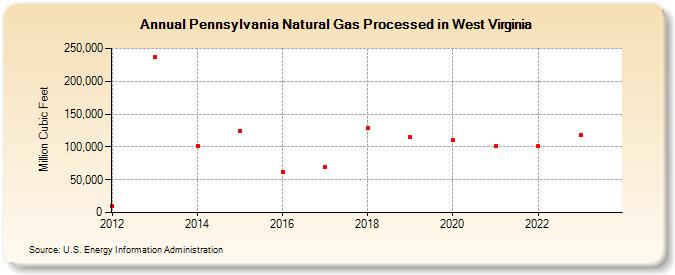
| Pennsylvania Natural Gas Processed in West Virginia (Million Cubic Feet) | |||||
| Decade | Year-0 | Year-1 | Year-2 | Year-3 | Year-4 | Year-5 | Year-6 | Year-7 | Year-8 | Year-9 |
|---|---|---|---|---|---|---|---|---|---|---|
| 2010's | 10,273 | 236,886 | 101,613 | 124,130 | 61,953 | 68,690 | 128,051 | 114,792 | ||
| 2020's | 109,982 | 101,824 | 101,824 | 117,841 | 117,561 |
| - = No Data Reported; -- = Not Applicable; NA = Not Available; W = Withheld to avoid disclosure of individual company data. |
| Release Date: 6/30/2026 |
| Next Release Date: 7/31/2026 |