|
Download Data (XLS File) |
|
|||||
|
|||||
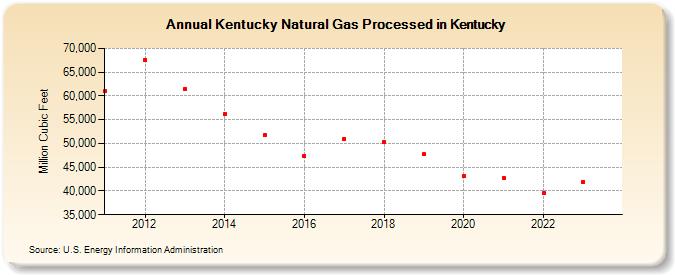
| Kentucky Natural Gas Processed in Kentucky (Million Cubic Feet) | |||||
| Decade | Year-0 | Year-1 | Year-2 | Year-3 | Year-4 | Year-5 | Year-6 | Year-7 | Year-8 | Year-9 |
|---|---|---|---|---|---|---|---|---|---|---|
| 2010's | 60,941 | 67,568 | 61,463 | 56,226 | 51,724 | 47,306 | 50,984 | 50,317 | 47,721 | |
| 2020's | 43,088 | 42,728 | 39,490 | 41,895 | 39,800 |
| - = No Data Reported; -- = Not Applicable; NA = Not Available; W = Withheld to avoid disclosure of individual company data. |
| Release Date: 6/30/2026 |
| Next Release Date: 7/31/2026 |
Referring Pages: