|
Download Data (XLS File) |
|
|||||
|
|||||
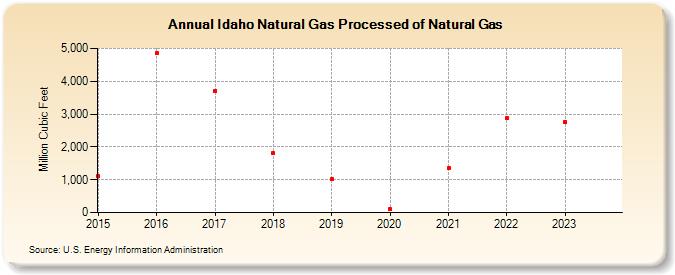
| Idaho Natural Gas Processed of Natural Gas (Million Cubic Feet) | |||||
| Decade | Year-0 | Year-1 | Year-2 | Year-3 | Year-4 | Year-5 | Year-6 | Year-7 | Year-8 | Year-9 |
|---|---|---|---|---|---|---|---|---|---|---|
| 2010's | 1,113 | 4,859 | 3,711 | 1,805 | 1,019 | |||||
| 2020's | 94 | 1,352 | 2,868 | 2,765 | 1,242 |
| - = No Data Reported; -- = Not Applicable; NA = Not Available; W = Withheld to avoid disclosure of individual company data. |
| Release Date: 6/30/2026 |
| Next Release Date: 7/31/2026 |