|
Download Data (XLS File) |
|
|||||
|
|||||
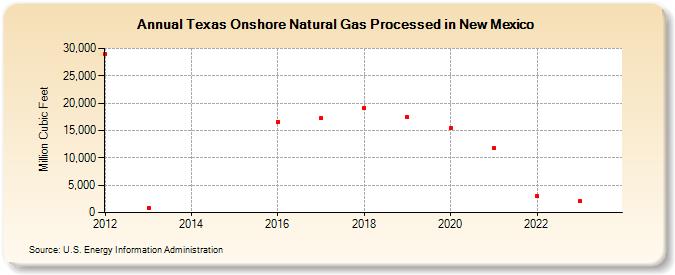
| Texas Onshore Natural Gas Processed in New Mexico (Million Cubic Feet) | |||||
| Decade | Year-0 | Year-1 | Year-2 | Year-3 | Year-4 | Year-5 | Year-6 | Year-7 | Year-8 | Year-9 |
|---|---|---|---|---|---|---|---|---|---|---|
| 2010's | 29,056 | 869 | 16,597 | 17,268 | 19,076 | 17,407 | ||||
| 2020's | 15,410 | 11,841 | 2,976 | 2,041 | 625 |
| - = No Data Reported; -- = Not Applicable; NA = Not Available; W = Withheld to avoid disclosure of individual company data. |
| Release Date: 6/30/2026 |
| Next Release Date: 7/31/2026 |