|
Download Data (XLS File) |
|
|||||
|
|||||
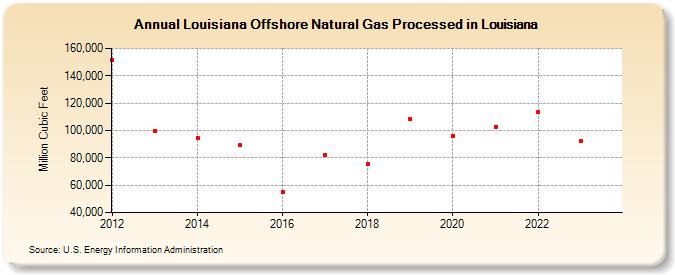
| Louisiana Offshore Natural Gas Processed in Louisiana (Million Cubic Feet) | |||||
| Decade | Year-0 | Year-1 | Year-2 | Year-3 | Year-4 | Year-5 | Year-6 | Year-7 | Year-8 | Year-9 |
|---|---|---|---|---|---|---|---|---|---|---|
| 2010's | 151,301 | 99,910 | 94,790 | 89,406 | 54,770 | 82,240 | 75,322 | 108,426 | ||
| 2020's | 96,133 | 102,502 | 113,347 | 92,096 | 41,961 |
| - = No Data Reported; -- = Not Applicable; NA = Not Available; W = Withheld to avoid disclosure of individual company data. |
| Release Date: 6/30/2026 |
| Next Release Date: 7/31/2026 |