|
Download Data (XLS File) |
|
|||||
|
|||||
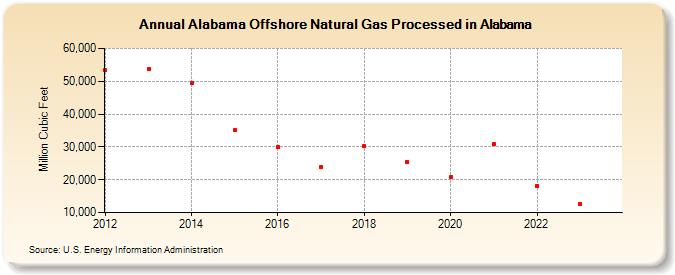
| Alabama Offshore Natural Gas Processed in Alabama (Million Cubic Feet) | |||||
| Decade | Year-0 | Year-1 | Year-2 | Year-3 | Year-4 | Year-5 | Year-6 | Year-7 | Year-8 | Year-9 |
|---|---|---|---|---|---|---|---|---|---|---|
| 2010's | 53,348 | 53,771 | 49,474 | 35,026 | 30,048 | 23,944 | 30,255 | 25,462 | ||
| 2020's | 20,702 | 30,869 | 18,238 | 12,572 | 17,593 |
| - = No Data Reported; -- = Not Applicable; NA = Not Available; W = Withheld to avoid disclosure of individual company data. |
| Release Date: 6/30/2026 |
| Next Release Date: 7/31/2026 |