|
Download Data (XLS File) |
|
|||||
|
|||||
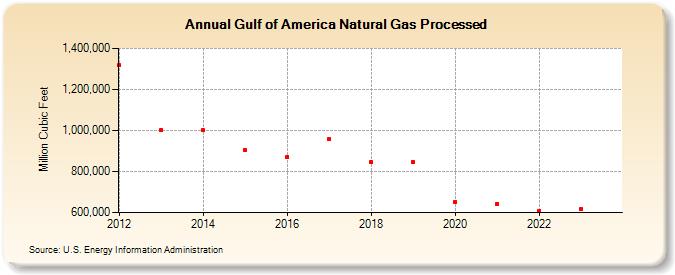
| Gulf of America Natural Gas Processed (Million Cubic Feet) | |||||
| Decade | Year-0 | Year-1 | Year-2 | Year-3 | Year-4 | Year-5 | Year-6 | Year-7 | Year-8 | Year-9 |
|---|---|---|---|---|---|---|---|---|---|---|
| 2010's | 1,317,031 | 1,002,608 | 1,000,964 | 902,550 | 871,086 | 957,645 | 847,545 | 844,268 | ||
| 2020's | 651,871 | 644,146 | 608,216 | 616,212 | 541,200 |
| - = No Data Reported; -- = Not Applicable; NA = Not Available; W = Withheld to avoid disclosure of individual company data. |
| Release Date: 6/30/2026 |
| Next Release Date: 7/31/2026 |