|
Download Data (XLS File) |
|
|||||
|
|||||
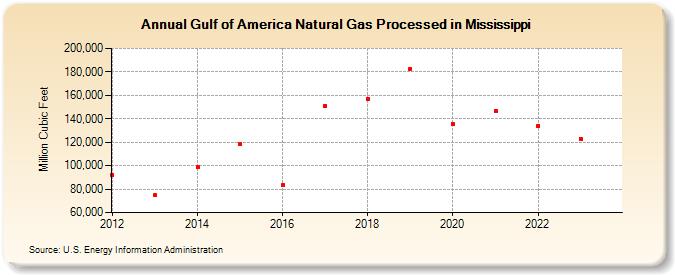
| Gulf of America Natural Gas Processed in Mississippi (Million Cubic Feet) | |||||
| Decade | Year-0 | Year-1 | Year-2 | Year-3 | Year-4 | Year-5 | Year-6 | Year-7 | Year-8 | Year-9 |
|---|---|---|---|---|---|---|---|---|---|---|
| 2010's | 91,618 | 74,637 | 98,497 | 118,368 | 83,396 | 150,933 | 156,913 | 182,553 | ||
| 2020's | 135,738 | 146,786 | 134,223 | 123,145 | 105,370 |
| - = No Data Reported; -- = Not Applicable; NA = Not Available; W = Withheld to avoid disclosure of individual company data. |
| Release Date: 6/30/2026 |
| Next Release Date: 7/31/2026 |