|
Download Data (XLS File) |
|
|||||
|
|||||
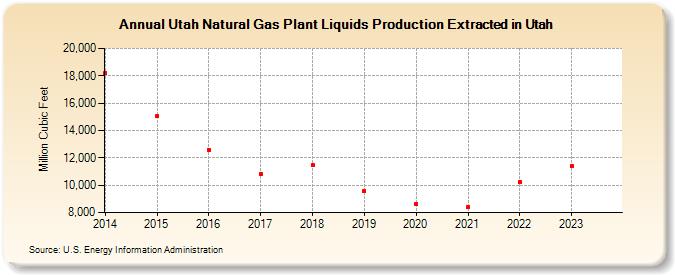
| Utah Natural Gas Plant Liquids Production Extracted in Utah (Million Cubic Feet) | |||||
| Decade | Year-0 | Year-1 | Year-2 | Year-3 | Year-4 | Year-5 | Year-6 | Year-7 | Year-8 | Year-9 |
|---|---|---|---|---|---|---|---|---|---|---|
| 2010's | 18,183 | 15,051 | 12,609 | 10,803 | 11,457 | 9,569 | ||||
| 2020's | 8,639 | 8,403 | 10,226 | 11,213 | 12,061 |
| - = No Data Reported; -- = Not Applicable; NA = Not Available; W = Withheld to avoid disclosure of individual company data. |
| Release Date: 6/30/2026 |
| Next Release Date: 7/31/2026 |