|
Download Data (XLS File) |
|
|||||
|
|||||
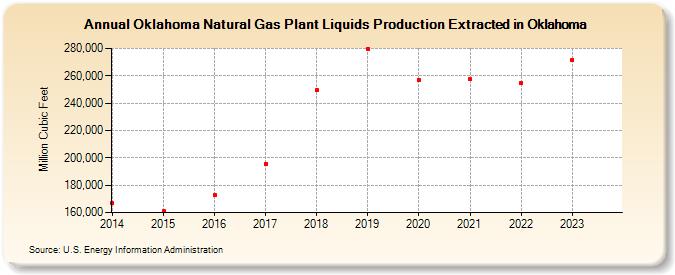
| Oklahoma Natural Gas Plant Liquids Production Extracted in Oklahoma (Million Cubic Feet) | |||||
| Decade | Year-0 | Year-1 | Year-2 | Year-3 | Year-4 | Year-5 | Year-6 | Year-7 | Year-8 | Year-9 |
|---|---|---|---|---|---|---|---|---|---|---|
| 2010's | 166,776 | 160,777 | 172,505 | 195,714 | 249,236 | 279,805 | ||||
| 2020's | 256,942 | 257,577 | 254,504 | 271,684 | 260,041 |
| - = No Data Reported; -- = Not Applicable; NA = Not Available; W = Withheld to avoid disclosure of individual company data. |
| Release Date: 6/30/2026 |
| Next Release Date: 7/31/2026 |