|
Download Data (XLS File) |
|
|||||
|
|||||
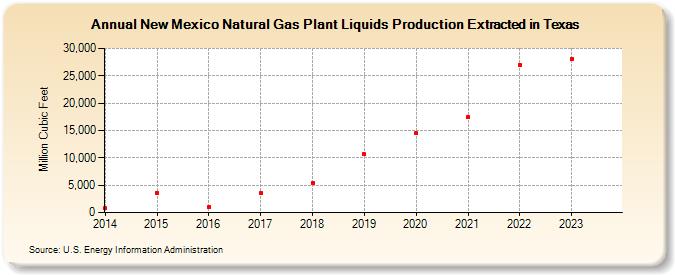
| New Mexico Natural Gas Plant Liquids Production Extracted in Texas (Million Cubic Feet) | |||||
| Decade | Year-0 | Year-1 | Year-2 | Year-3 | Year-4 | Year-5 | Year-6 | Year-7 | Year-8 | Year-9 |
|---|---|---|---|---|---|---|---|---|---|---|
| 2010's | 755 | 3,621 | 1,030 | 3,529 | 5,432 | 10,641 | ||||
| 2020's | 14,472 | 17,451 | 27,044 | 28,040 | 31,220 |
| - = No Data Reported; -- = Not Applicable; NA = Not Available; W = Withheld to avoid disclosure of individual company data. |
| Release Date: 6/30/2026 |
| Next Release Date: 7/31/2026 |