|
Download Data (XLS File) |
|
||||||||
|
||||||||
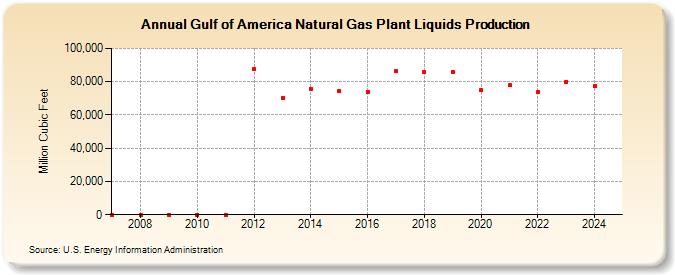
| Gulf of America Natural Gas Plant Liquids Production (Million Cubic Feet) | ||||||||
| Decade | Year-0 | Year-1 | Year-2 | Year-3 | Year-4 | Year-5 | Year-6 | Year-7 | Year-8 | Year-9 |
|---|---|---|---|---|---|---|---|---|---|---|
| 2000's | 0 | 0 | 0 | |||||||
| 2010's | 0 | 0 | 87,478 | 70,292 | 75,648 | 74,564 | 74,057 | 86,172 | 85,865 | 85,962 |
| 2020's | 74,694 | 77,696 | 73,631 | 80,019 | 77,320 |
| - = No Data Reported; -- = Not Applicable; NA = Not Available; W = Withheld to avoid disclosure of individual company data. |
| Release Date: 6/30/2026 |
| Next Release Date: 7/31/2026 |