|
Download Data (XLS File) |
|
|||||
|
|||||
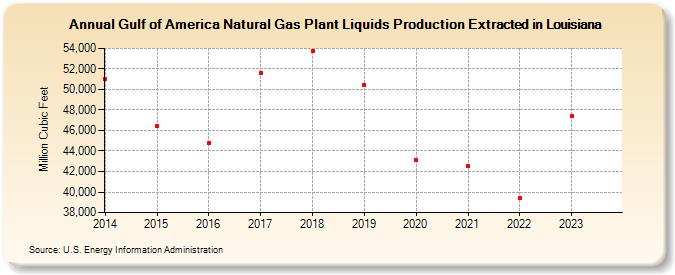
| Gulf of America Natural Gas Plant Liquids Production Extracted in Louisiana (Million Cubic Feet) | |||||
| Decade | Year-0 | Year-1 | Year-2 | Year-3 | Year-4 | Year-5 | Year-6 | Year-7 | Year-8 | Year-9 |
|---|---|---|---|---|---|---|---|---|---|---|
| 2010's | 51,010 | 46,429 | 44,745 | 51,637 | 53,724 | 50,472 | ||||
| 2020's | 43,108 | 42,534 | 39,427 | 47,380 | 44,245 |
| - = No Data Reported; -- = Not Applicable; NA = Not Available; W = Withheld to avoid disclosure of individual company data. |
| Release Date: 6/30/2026 |
| Next Release Date: 7/31/2026 |