|
Download Data (XLS File) |
|
||||||||
|
||||||||
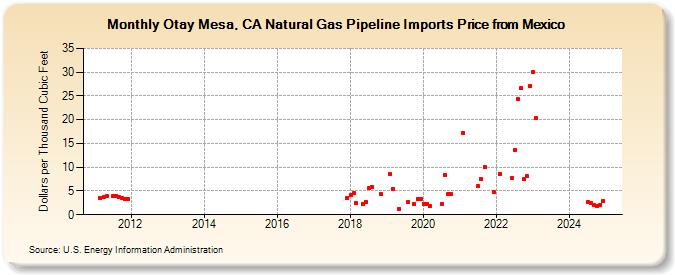
| Otay Mesa, CA Natural Gas Pipeline Imports Price from Mexico (Dollars per Thousand Cubic Feet) | ||||||||
| Year | Jan | Feb | Mar | Apr | May | Jun | Jul | Aug | Sep | Oct | Nov | Dec |
|---|---|---|---|---|---|---|---|---|---|---|---|---|
| 2011 | 3.62 | 3.65 | 3.88 | 3.90 | 4.02 | 3.66 | 3.55 | 3.24 | 3.30 | |||
| 2017 | 3.53 | |||||||||||
| 2018 | 4.18 | 4.50 | 2.42 | 2.27 | 2.77 | 5.54 | 5.87 | 4.29 | ||||
| 2019 | 8.61 | 5.43 | 1.30 | 2.69 | 2.28 | 3.28 | 3.38 | |||||
| 2020 | 2.33 | 2.16 | 1.76 | 2.31 | 8.42 | 4.30 | 4.30 | |||||
| 2021 | 17.16 | 6.01 | 7.48 | 10.00 | 4.78 | |||||||
| 2022 | 8.65 | 7.77 | 13.54 | 24.33 | 26.56 | 7.45 | 8.09 | 27.10 | ||||
| 2023 | 30.02 | 20.33 | ||||||||||
| 2024 | 2.76 | 2.39 | 1.98 | 1.80 | 2.11 | 2.84 | ||||||
| - = No Data Reported; -- = Not Applicable; NA = Not Available; W = Withheld to avoid disclosure of individual company data. |
| Release Date: 12/31/2025 |
| Next Release Date: 1/30/2026 |