|
Download Data (XLS File) |
|
||||||||
|
||||||||
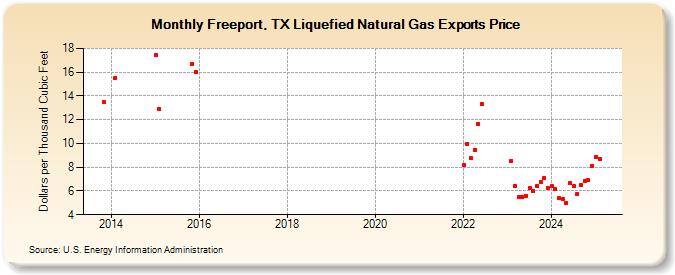
| Freeport, TX Liquefied Natural Gas Exports Price (Dollars per Thousand Cubic Feet) | ||||||||
| Year | Jan | Feb | Mar | Apr | May | Jun | Jul | Aug | Sep | Oct | Nov | Dec |
|---|---|---|---|---|---|---|---|---|---|---|---|---|
| 2013 | 13.45 | |||||||||||
| 2014 | 15.51 | |||||||||||
| 2015 | 17.44 | 12.89 | 16.71 | 15.99 | ||||||||
| 2019 | W | W | W | W | ||||||||
| 2020 | W | W | W | W | W | W | W | W | W | W | W | W |
| 2021 | W | W | W | W | W | W | W | W | W | W | W | W |
| 2022 | 8.18 | 9.97 | 8.74 | 9.43 | 11.67 | 13.33 | ||||||
| 2023 | 8.56 | 6.38 | 5.51 | 5.46 | 5.59 | 6.22 | 6.01 | 6.41 | 6.79 | 7.09 | 6.22 | |
| 2024 | 6.41 | 6.17 | 5.37 | 5.31 | 4.99 | 6.64 | 6.41 | 5.75 | 6.48 | 6.83 | 6.92 | 8.12 |
| 2025 | 8.84 | 8.67 | 8.59 | 8.36 | 7.27 | 7.81 | 7.67 | 7.59 | 6.99 | 7.38 | 7.61 | 8.14 |
| 2026 | 8.76 | 10.71 | 8.87 | 8.16 | ||||||||
| - = No Data Reported; -- = Not Applicable; NA = Not Available; W = Withheld to avoid disclosure of individual company data. |
| Release Date: 6/30/2026 |
| Next Release Date: 7/31/2026 |