|
Download Data (XLS File) |
|
||||||||
|
||||||||
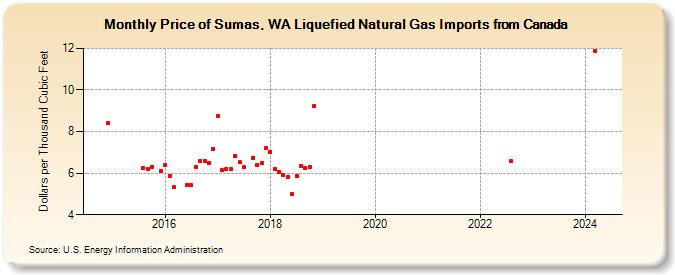
| Price of Sumas, WA Liquefied Natural Gas Imports from Canada (Dollars per Thousand Cubic Feet) | ||||||||
| Year | Jan | Feb | Mar | Apr | May | Jun | Jul | Aug | Sep | Oct | Nov | Dec |
|---|---|---|---|---|---|---|---|---|---|---|---|---|
| 2014 | 8.42 | |||||||||||
| 2015 | 6.25 | 6.20 | 6.31 | 6.10 | ||||||||
| 2016 | 6.38 | 5.86 | 5.31 | 5.42 | 5.41 | 6.29 | 6.58 | 6.56 | 6.49 | 7.16 | ||
| 2017 | 8.73 | 6.15 | 6.22 | 6.19 | 6.84 | 6.54 | 6.28 | 6.74 | 6.40 | 6.47 | 7.22 | |
| 2018 | 7.04 | 6.21 | 6.07 | 5.93 | 5.80 | 5.01 | 5.87 | 6.33 | 6.25 | 6.29 | 9.23 | |
| 2019 | W | |||||||||||
| 2020 | W | W | W | W | ||||||||
| 2021 | W | W | W | W | W | |||||||
| 2022 | 6.58 | |||||||||||
| 2023 | 12.95 | |||||||||||
| 2024 | 13.77 | 11.89 | ||||||||||
| - = No Data Reported; -- = Not Applicable; NA = Not Available; W = Withheld to avoid disclosure of individual company data. |
| Release Date: 3/31/2026 |
| Next Release Date: 4/30/2026 |